Tampilkan postingan dengan label SST. Tampilkan semua postingan

Sabtu, 04 Oktober 2014

Record June–August Global Ocean Surface Temperature

August 2014 record high land and ocean temperature

The combined average temperature across global land and ocean surfaces for August 2014 was record high for the month, at 0.75°C (1.35°F) above the 20th century average of 15.6°C (60.1°F).

June–August 2014 record high land and ocean temperature

June–August 2014, at 0.71°C (1.28°F) higher than the 20th century average, was the warmest such period across global land and ocean surfaces since record keeping began in 1880.

August 2014 record high sea surface temperature

The August global sea surface temperature (SST) was 0.65°C (1.17°F) above the 20th century average of 16.4°C (61.4°F). This record high departure from average not only beats the previous August record set in 2005 by 0.08°C (0.14°F), but also beats the previous all-time record set just two months ago in June 2014 by 0.03°C (0.05°F).

June–August 2014 record high sea surface temperature

The June–August global ocean surface temperature was 0.63°C (1.13°F) above the 20th century average, the highest on record for June–August. This beats the previous record set in 2009 by 0.04°C (0.07°F).


John Davies comments: 

This was the warmest August on record, primarily due to very high Sea Surface Temperatures in the Northern Hemisphere.

There is no El Nino event in this period, but some sort of event - hopefully an event not a climate shift - is taking place. If this is an event, the situation will become more normal when it ends, which will be in less than a years time at worst. If it is a climate shift, we are in desperate trouble, though I think it is an event.

It is worth noting that these very high Sea Surface Temperatures are likely to lead to high land temperatures soon, as normally land temperatures in the Northern hemisphere can be expected to exceed Sea Surface Temperatures.

The drought affecting California and the whole of the west of North America, Central America, and large parts of the Brazilian rainforest, though preceding this event was almost certainly down to changes which started before this event but ultimately caused it.


Despite the record high combined average temperature across global land and ocean surfaces for August, the global economy will continue as normal and no specific action can be expected to be taken to curb emissions. This will change, if global temperatures continue to rise. Temperatures are high enough to cause global concern, however. More later.


Note: NOAA's most recent (Sep 4, 2014) prediction puts the chance of El Niño at 60-65% during the Northern Hemisphere fall and winter.


Sea surface temperatures (SST) can be expected to remain high in the Arctic Ocean, as SST anomalies are high in the North Atlantic (+1.65°C, image left) and high temperatures are forecast over the Arctic for at least the next seven days (anomalies as high as +2.87°C, image right). For a comparison with October 3 temperatures, see this earlier post.

Additionally, an increasing amount of heat has been going into the deeper parts of the ocean, and the Gulf Stream will for month to come continue to transport water into the Arctic Ocean, and this water will be warmer than the water already there, threatening to unleash ever larger eruptions of methane from the seafloor of the Arctic Ocean, as discussed in this earlier post.

In conclusion, the situation is dire and calls for comprehensive and effective action, as discussed at the Climate Plan blog.


References

- NOAA National Climatic Data Center, State of the Climate: Global Analysis for August 2014.
http://www.ncdc.noaa.gov/sotc/global/2014/8

- EL NIÑO/SOUTHERN OSCILLATION (ENSO) DIAGNOSTIC DISCUSSION, issued by:
Climate Prediction Center/NCEP/NWS and the International Research Institute for Climate and Society, 4 September 2014
http://www.cpc.ncep.noaa.gov/products/analysis_monitoring/enso_advisory/ensodisc.pdf

- ENSO: Recent Evolution, Current Status and Predictions
http://www.cpc.ncep.noaa.gov/products/analysis_monitoring/lanina/enso_evolution-status-fcsts-web.pdf

- ClimateReanalyzer.org
http://climatereanalyzer.org


Selasa, 30 September 2014

Warm water extends from Laptev Sea to North Pole

The NOAA NESDIS image below shows sea surface temperature anomalies of well over 1ºC extending to the North Pole.


The image below gives a world view, showing SST anomalies at the top end of the scale in the Laptev Sea.


The top end of the scale on the above image is 5ºC (or 9ºF).


The visualizations above and below uses a much higher scale. Even this higher-end scale doesn't appear to fully capture the dire situation we are in.


Above image shows warm water entering the Arctic Ocean through the Bering Strait and from the North Atlantic. For months to come, the Gulf Stream will keep pushing warm water into the Arctic Ocean (i.e. water that is warmer than the water in the Arctic Ocean). It takes some time (i.e. months) for the warm water from the north Atlantic to arrive in the Arctic Ocean.

Last year, methane emissions started to become huge in October and this lasted for some six months. The image below, from an earlier post, shows methane eruptions from the seafloor of the Arctic Ocean on October 16/17, 2013.


The image below, from another earlier post, shows methane eruptions from the seafloor of the Arctic Ocean on October 31, 2013.


The image below, from yet another earlier post, shows methane levels as high as 2662 parts per billion on November 9, 2013.


This year, there is even more ocean heat present, especially in the north Atlantic and the north Pacific. On September 29, 2014, methane levels as high as 2641 parts per billion were recorded and it looks like worse is yet to come.


The video below, Sea floor methane hydrate climate hazard, is an extract produced by Peter Carter from a presentation by Miriam Kastner, uploaded 7 August 2008 at Youtube.


The situation is dire and calls for comprehensive and effective action, as discussed at the Climate Plan blog.


Sabtu, 30 Agustus 2014

Warming waters threaten to trigger methane eruptions from Arctic Ocean seafloor


K. Tung / Univ. of Washington. (Top) Global
average surface temperatures, where black dots
are yearly averages. Two flat periods (hiatus)
are separated by rapid warming from 1976-1999.
(Middle) Observations of heat content, compared
to the average, in the north Atlantic Ocean.
(Bottom) Salinity of the seawater in the same
part of the Atlantic. Higher salinity is seen
to coincide with more ocean heat storage.
A new study looks at how, in the 21st century, surface warming slowed as more heat moved deeper into the oceans, specifically the North Atlantic.

Sun-warmed salty water travels north along ocean currents in the Atlantic. When this saltier water reaches the North Atlantic, its greater density causes it to sink. From about 1999, this current began to speed up and draw heat deeper into the ocean.

These huge amounts of heat moving deeper into the Atlantic Ocean are very worrying.

The image below shows that sea surface temperatures have reached extremely high levels on the Northern Hemisphere, where sea surface temperature anomalies as high as 1.78 degrees Celsius were recorded on August 19, 2014.

As discussed in an earlier post, water carried by the Gulf Stream below the surface can be even warmer than surface waters. As the post discusses, high sea surface temperatures west of Svalbard indicate that the Gulf Stream can carry very warm water (warmer than 16°C) at greater depths and is pushing this underneath the sea ice north of Svalbard. Similarly, warm water from greater depth comes to the surface where the Gulf Stream pushes it against the west coast of Novaya Zemlya.


Very warm water is now invading the Arctic Ocean through the Bering Strait from the Pacific Ocean, while very warm water is also traveling on the back of the Gulf Stream from the North Atlantic into the Arctic Ocean.


The danger is that this warm water will destabilize hydrates contained in sediments under the Arctic Ocean and trigger huge methane eruptions.

Rising methane levels over the past few years are ominous in this respect. The image below shows very high mean global methane levels on August 28, 2014, while methane readings as high as 2561 ppb were recorded on that day.

Methane Levels -  see earlier post for a discussion of IPCC/NOAA data

In conclusion, the situation is dire and calls for comprehensive and effective action, as discussed at the Climate Plan blog.


References and Related Links

- Varying planetary heat sink led to global-warming slowdown and acceleration
by Xianyao Chen and Ka-Kit Tung.
http://www.sciencemag.org/content/345/6199/897

- Cause of global warming hiatus found deep in the Atlantic Ocean
University of Washington News Release
http://www.washington.edu/news/2014/08/21/cause-of-global-warming-hiatus-found-deep-in-the-atlantic-ocean

- Horrific Methane Eruptions in East Siberian Sea
http://arctic-news.blogspot.com/2014/08/horrific-methane-eruptions-in-east-siberian-sea.html

- Methane Buildup in the Atmosphere
http://arctic-news.blogspot.com/2014/04/methane-buildup-in-atmosphere.html

- Climate Plan blog
http://climateplan.blogspot.com


Selasa, 19 Agustus 2014

Persistently High Methane Concentrations over Beaufort Sea

High methane concentrations have been showing up over Beaufort Sea over the past few days, as shown on the image below. This follows the recent high methane concentrations over the East Siberian Sea.


The persistent character of these very high methane concentrations over the Arctic Ocean indicates that methane has started to erupt from clathrates under the seabed, triggered by very warm water reaching the bottom of the Arctic Ocean.

Methane eruptions from hydrates in sediments under the Arctic Ocean helped mean methane levels reach new records, with mean global methane readings as high as 1835 parts per billion recorded at several altitudes on August 17, 2014.


The very high sea surface temperature anomalies that show up on above image give an idea of the inflow of warm water from the Pacific Ocean through the Bering Strait. This is further highlighted by the combination image below.

[ click on image to enlarge ]
The situation is dire and calls for comprehensive and effective action, as discussed at the Climate Plan blog.


Senin, 04 Agustus 2014

Warm waters threaten to trigger huge methane eruptions from Arctic Ocean seafloor

The evidence of abrupt high methane releases in the Arctic Ocean is accumulating. The graph below shows in situ methane measurements taken at the Barrow Observatory, including recent levels as high as close to 2200 parts per billion (ppb).


Satellite data picture a similarly dire situation. Global mean methane levels as high as 1831 ppb were recorded on the morning of July 30, 2014, while peak methane levels as high as 2330 ppb were recorded that morning. More recently, peak methane levels as high as 2522 ppb were recorded (on August 2, 2014).

IPCC/NOAA figures suggest that methane levels were rising by some 5 to 6 ppb annually, reaching 1814 ppb in 2013. While methane levels at lower altitudes have indeed shown little rise, much larger rises have been recorded at higher altitudes, as illustrated by the image below.


These high methane levels recorded at higher altitudes appear to be caused by the huge quantities of methane released from the seafloor of the Arctic Ocean during the period from end 2013 to early 2014. This methane has meanwhile risen to higher altitudes, while also descending to lower latitudes, wreaking havoc on weather patterns around latitude 60° North.

The releases of methane from the seafloor of the Arctic Ocean were caused by water that had warmed up strongly off the east coast of North America from June 2013. It took some months for this warm water to be carried by the Gulf Stream into the Arctic Ocean.


Meanwhile, very high sea surface temperatures are recorded in the Arctic Ocean, as above image shows, while warm water is carried into the Arctic Ocean by the Gulf Stream, as illustrated by the image below.


As said, the situation is dire and calls for comprehensive and effective action, as discussed at the Climate Plan blog.


Jumat, 04 Juli 2014

The Threat of Storms Wreaking Havoc in the Arctic Ocean

Arctic sea ice extent is close to a record low for the time of the year, as the image below shows.


Furthermore, the current decline in sea ice extent is much steeper than it used to be for this time of the year, raising the specter of sea ice hitting an absolute record low later this year. Moreover, a total collapse of sea ice may occur if storms continue to develop that push the remaining ice out of the Arctic Ocean into the Atlantic Ocean.


The threat posed by storms is illustrated by the track projected to be followed by Hurricane Arthur (above NOAA image, July 4), renamed as Post-Tropical Cyclone Arthur (NOAA image below, July 5).


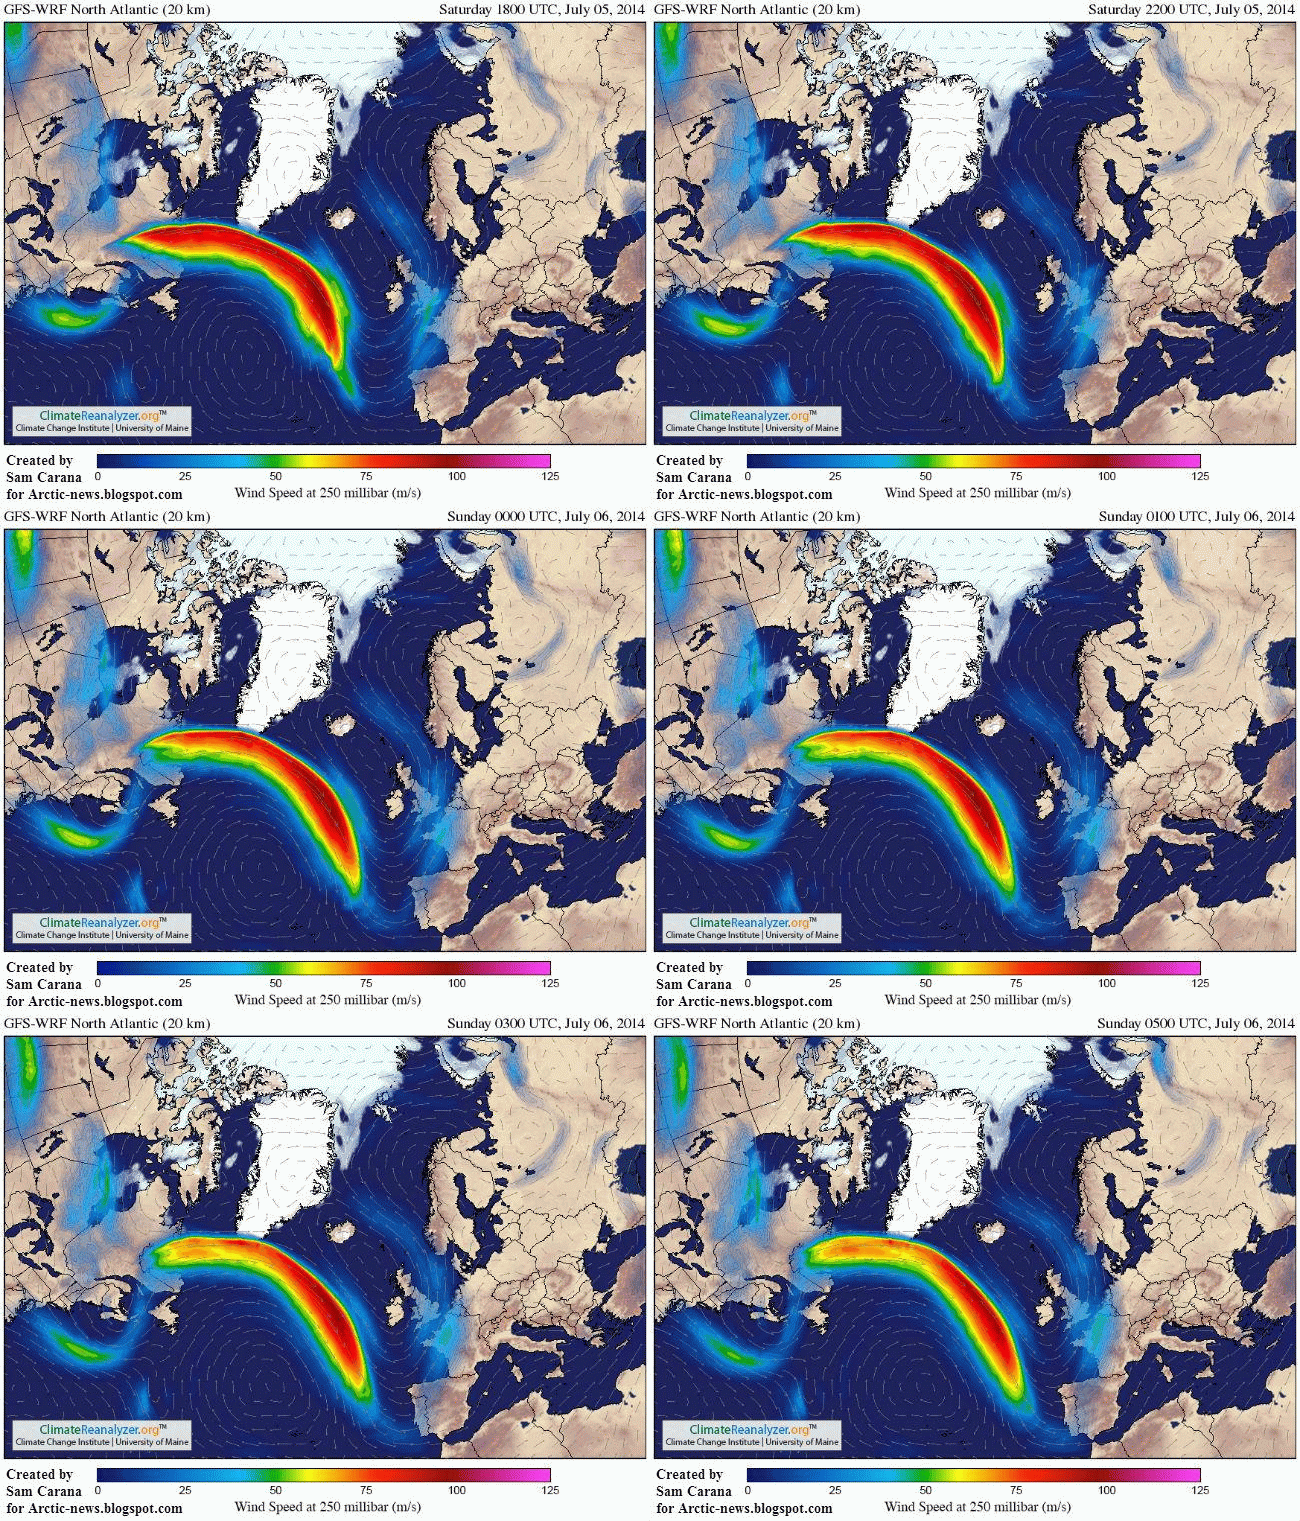
The path followed by Arthur is influenced by the current shape of the jet stream. As the animation below illustrates, the jet stream looks set to prevent Hurrican Arthur from moving to the east and instead make it move into the Labrador Sea to the west of Greenland and - partly due to the high mountains on Greenland - continue to wreak havoc in Baffin Bay further north.

[ Note: this animation is a 1.87 MB file that may take some time to fully load ]
As described in an earlier post, post-tropical cyclone Leslie made landfall with hurricane-force winds in Newfoundland in September 2012. The large extratropical low pressure system continued to move rapidly northeastward across eastern Newfoundland at a forward speed of near 45 kt, and merged with a much larger extratropical low over the Labrador Sea.

Recent research by NOAA-affiliated scientists suggests that - over the years - the latitude where hurricanes, typhoons, and cyclones reach their maximum intensity on the Northern Hemisphere has shifted closer to the North Pole.

Such storms can bring lots of heat and moisture into the Arctic, and they can also increase the height of waves. All this can have devastating impact on the sea ice. The many ways in which storms can increase the dangerous situation in the Arctic is described in the post Feedbacks in the Arctic.

Last month, the June heat record broke in Greenland. Very high temperatures are currently recorded all over North America, as the image below shows.


Furthermore, sea surface temperature anomalies in the Arctic are currently very high, as the image below shows.


Additionally, the sea ice is currently very thin, as shown by the Naval Research Laboratory animation below.


The above animation further shows that there now is very little sea ice left in Baffin Bay, making it easier for storms to cause very high waves that could enter the Arctic Ocean and break the sea ice north of Greenland and Canada.

Arctic sea ice volume minimum is typically reached around halfway into September. This is still months away, but the prospect of an El Niño event striking this year now is 90%, according to predictions by the European Centre for Medium-range Weather Forecasts.

All this combines into a growing threat that hydrates contained in sediments will destabilize and that huge quantities of methane will be released abruptly from the seafloor of the Arctic Ocean. The risk that this will eventuate is intolerable and calls for parallel lines of action as pictured in the image below.

Climate Plan, July 7, 2014 version, as discussed at this Climate Plan post and at the Climate Plan blog

Related

- Storm enters Arctic region
arctic-news.blogspot.com/2012/09/storm-enters-arctic-region.html

- Huge cyclone batters Arctic sea ice
arctic-news.blogspot.com/2012/08/huge-cyclone-batters-arctic-sea-ice.html

- Hurricane Sandy moving inland
http://arctic-news.blogspot.com/2012/10/hurricane-sandy-moving-inland.html

- Feedbacks in the Arctic
http://arctic-news.blogspot.com/2014/03/feedbacks-in-the-artcic.html


Minggu, 29 Juni 2014

High temperatures in the Arctic

The NOAA map below shows sea surface temperature anomalies above 8 degrees Celsius in the Arctic Ocean.


These anomalies are very high, considering that it is now June and the melting season has only just begun.

Partly causing these high temperatures in the Arctic Ocean is water flowing into the Arctic Ocean from rivers. As the map below shows, a number of large rivers flowing through Siberia end in the Arctic Ocean.

map from: http://en.wikipedia.org/wiki/File:Rs-map.png
The Naval Research Laboratory image below shows waters with very low salinity levels (top white rectangles) where warm water from rivers in Siberia enters the Arctic Ocean.


Accelerated warming of the Arctic has changed (and is still further changing) the Jet Streams, increasing the occurence of heat waves on the Norhern Hemisphere that cause huge amounts of warm water to flow into the Arctic Ocean. This is illustrated by the animation below.


[ note: animation is a 2 MB file that may take some time to fully load - click on image to enlarge ]
Another spot to watch, indicated on above map with the bottom white rectangle, is where the Mackenzie River flows into the Beaufort Sea. In this area, sea surface temperatures up to ~17°C (63°F) were recorded from June 26 to 28, 2014, as illustrated by the image below.


As the map below shows, similarly high sea surface temperatures were recorded in the Bering Strait.


High temperatures over North America are making the situation worse. On June 28, 2014, temperatures as high as 27°C (81°F) were recorded in the north of Canada and temperatures as high as 23°C (74°F) were recorded in Alaska, as the map below illustrates.

[ click on image to enlarge ]
The 15-hour forecast below, run on June 29, 2014, shows temperatures in the north of North America of up to ~30°C (86°F) in many areas.


As long as the soil is frozen and covered with snow and ice, much of the sunlight is reflected back into space, while much of the sunlight that gets absorbed goes into melting the snow and ice. Once the snow and ice has melted, that energy goes into heating up the soil. The energy required to melt a volume of ice can raise the temperature of the same volume of rock by 150º C.

In Greenland, meltwater percolation is causing latent heat transport into the firn, making it warm up by as much as +5.7°C at midlevel elevations (1400–2500 m), according to a recent study by Polashenski et al.


The situation is particularly dire for the Arctic Ocean, due to the very warm water on the Northern Hemisphere, currently featuring a sea surface temperature anomaly above 1.5º C, as illustrated by above image.

The prospect of an El Niño event striking this year now is 90%, according to predictions by the European Centre for Medium-range Weather Forecasts.

Arctic sea ice volume minimum is typically reached around halfway into September.

This is still months away, and the number of days the Arctic Ocean is covered by sea ice has fallen dramatically over the years, as illustrated by the image on the right, from a recent study by Claire Parkinson.

The danger is that heat will penetrate sediments underneath the Arctic Ocean that contain huge amounts of methane in the form of hydrates and free gas, resulting in huge eruptions of methane from the seafloor of the Arctic ocean, as described at the methane-hydrates blog.

This risk is intolerable and calls for comprehensive and effective action, as discussed at the Climate Plan blog.


Selasa, 19 November 2013

Arctic Methane Release and Rapid Temperature Rise are interlinked

The image below shows methane readings on November 17, 2013 p.m.

[ click on image to enlarge ]
Very high methane readings are present over the Laptev Sea, the East Siberian Sea and the Beaufort Sea. The situation may be even worse than what it seems at first glance. The pointed shape in the Laptev Sea doesn't imply low methane levels in that area. The IASI (Infrared Atmospheric Sounding Interferometer) instrument measuring methane only covers a certain width. The pointed shapes that show up on above image and the bottom inset, are areas where no measurements were taken, resulting from the way the polar-orbiting satellite circum-navigates the globe, as pictured on the top inset. These pointed shapes are visible as light-grey areas on the image below.

Additionally, no data were available for the areas colored darker grey on above image. At lower altitudes, this absence of data can be due to mountains in the area. It can also be that measurements are obscured by clouds, in which case no data are visible for the respective area; again, this doesn't imply that no methane was present there.

So, while there are no data for some areas in the Laptev Sea on Nov. 17, the conclusion must noretheless be that methane was actually present at very high levels all the way from the Laptev Sea to the East Siberian Sea. This conclusion is supported by data from earlier days, e.g. as shown in this post.

Therefore, the situation in the Laptev Sea is worse that it looks at first glance and levels may actually have been even higher on Nov. 17 than the peak reading of 2304 ppb that was recorded on that day. Similarly, more methane may actually be present closer to the North Pole than is showing up on above images.

Why methane is rising from the Arctic seabed

For some time now, huge amounts of methane have been released from the seabed of the Arctic Ocean, reaching the atmosphere at levels of up to 2662 ppb (on November 9, 2013). What caused this? Before examining this further, let's first go back to what was said in an earlier post about warm water off the coast of North Anmerica.

A dust storm approaches Stratford, Texas, in 1935. From: Wikipedia: Dust Bowl
During the 1930s, North America experienced a devastating drought affecting almost two-thirds of the United States as well as parts of Mexico and Canada. The period is referred to as the Dust Bowl, for its numerous dust storms.

Rapid creation of farms and use of gasoline tractors had caused erosion at massive scale.

Extensive deep plowing of the virgin topsoil of the Great Plains in the preceding decade had removed the natural deep-rooted vegetation that previously kept the soil in place and trapped moisture even during periods of drought and high winds.

So, when the drought came, the dust storms emerged. But what caused the drought?

A 2004 study concludes that the drought was caused by anomalous tropical sea surface temperatures (SST) during that decade and that interactions between the atmosphere and the land surface increased its severity (see image above right with SST anomalies).

As the above chart shows, SST anomalies in the days of the Dust Bowl were not greater than 1°C. It is in this context that the current situation in the Arctic must be seen. In 2013, SST anomalies of 5°C or more showed up in virtually all areas in the Arctic Ocean where the sea ice disappeared; some areas are exposed to sea surface temperature anomalies even higher than 8°C (14.4°F), as discussed in the post Arctic Ocean is turning red.


As the above Naval Research Laboratory image shows, strong winds can push a lot of sea ice out of the Arctic Ocean. The resulting absence of sea ice can disrupt vertical sea currents that would otherwise cool the seabed. Furthermore, strong winds can boost warming of the seabed of the Arctic Ocean by mixing warm surface water down the vertical water column. Such feedbacks have been discussed in earlier posts such as the Diagram of Doom. Changes that take place in the Arctic can also cause extreme weather patterns elsewhere, as discussed in an earlier post on changes to the Polar Jet Stream.

Indeed, events can be closely interlinked and the world is now stumbling from one extreme weather event into another. Moreover, things look set to get worse every year. And this can in turn make things even worse in the Arctic. Water off the coast of North America, after reaching 'Record Warmest' temperatures in July 2013, proceeded to travel to the Arctic Ocean, where it is now warming up the seabed.
NOAA: part of the Atlantic Ocean off the coast of North America reached record warmest temperatures in July 2013
Below, Malcolm Light explains:

Pollution clouds pouring eastwards off the coast of Canada and the United States are the main culprits in heating the Gulf Stream as this region has the highest oceanic evaporation on Earth.


While the mean speed of the Gulf Stream is 4 miles per hour (6.4 km/hour or 1.78 metres/second), the water slows down as it travels north.

In the much wider North Atlantic Current, which is its North Eastern extension, water flows at about 0.51 metres/second (3.5 times slower), while the West Spitzbergen (Svalbard) current flows at about 0.35 metres/second (5 times slower).

Consequently, it will take quite some time for the summer-heated Gulf Stream waters to reach the Laptev Sea.

In addition, because the Gulf Stream does a closed circuit in the tropical Atlantic, passing close to West Africa (Canary Current) and returning back to the Gulf along the hurricane tracks (North Equitorial Current), it is able to continuously feed hot water into the North Atlantic Current over a very long time period.

This explains why methane is continuously boiling off the subsea methane hydrates from the Eurasian Basin and Laptev Sea during September to November this year and will continue to be emitted past January 2014.

How much will temperatures rise?

The atmospheric temperature increase in Australia this year (0.22oC) indicates that in 10 years it will exceed 2.2oC and in 30 to 40 years, 6.6oC to 8.8oC.

This is the same as the predicted temperature increase from the Arctic methane build up and will lead to total global deglaciation and our extinction by the middle of this century.

There is in addition a delayed carbon dioxide and methane temperature anomaly of 12oC to 20oC.  The 20oC  methane delayed temperature anomaly is the same as the temperature anomaly of the hot clouds that have been blowing around the Arctic this year, indicating that the Arctic has almost caught up with the methane delayed global warming heating.

The stage is therefore set for a giant firestorm, drought and sea level rise mostly caused by the uncontrolled build up of methane in the atmosphere due to the carbon dioxide induced global warming destabilization of the Arctic permafrost and subsea methane hydrates.

So, what to do?

The power, prestige and massive economy of the United States have been built on cheap and abundant fossil fuels and Canada is now trying to do the same. Will the US and Canada, in the short time frame we have left (3 decades), be able to eliminate their extreme carbon footprints? Note that Australia, Saudi Arabia and the United Arab Emirates have similar extreme carbon footprints as well. An additional problem is that reducing emissions from coal-fired power plants will also reduce sulfur emissions that currently mask the full wrath of global warming.

A Comprehensive Climate Plan must include ways to reduce methane levels

What we have got to do is eliminate as much of the atmospheric methane by whatever means we are able to devise,  to bring its concentration down to about 750 ppb. This level will eliminate the methane delayed temperature anomaly and give the massive industrial nations a little leaway to get their houses in order.

All the scientific expenditure and ingenuity of the major industrial nations should be engaged in developing methods of breaking down atmospheric methane without burning it. Methods of increasing the tropospheric and stratospheric hydroxyl concentrations and using radio - laser systems such as the Alamo - Lucy projects and their applications to HAARP must be developed and tested with the utmost urgency as should local methods of converting carbon dioxide and methane via catalysts into other products. We have to get rid of this methane monster before it devours us all. A French group of scientists and engineers have started work on the Alamo-Lucy projects in Europe. If we fail to reduce the fast growing methane content of the atmosphere in the next few decades we are going to go the same way as the dinosaurs.

I cannot emphasise more, how serious humanity’s predicament is and what we could do to try to prevent our certain extinction if we continue down the present path we are following. If we compare ourselves to the Titanic we are only moments away from hitting the iceberg.


Three more images are added to further illustrate Malcolm Light's words. The above image highlights how much temperatures have been rising in the Arctic over the past few decades. In above image, anomalies are visualized by latitude, but are averaged by longitude globally, masking even higher anomalies that can be experienced at specific areas along the same longitude. At times, some areas in the Arctic do already experience anomalies of over 20°C, as also shown by the image below. 

Finally, the image below, from a post at the methane-hydrates blog


All this calls for comprehensive and effective action, as described at the Climate Plan blog


Related

- Causes of high methane levels over Arctic Ocean

- Climate Plan

- Horrific amounts of methane over Laptev Sea

- Methane Levels going through the Roof

- Unfolding Methane Catastrophe

- Methane Release caused by Earthquakes

- Temperature Rise

- North Hole

- The LUCY project

- The Alamo Project