Arctic Sea Ice Minimum Volume

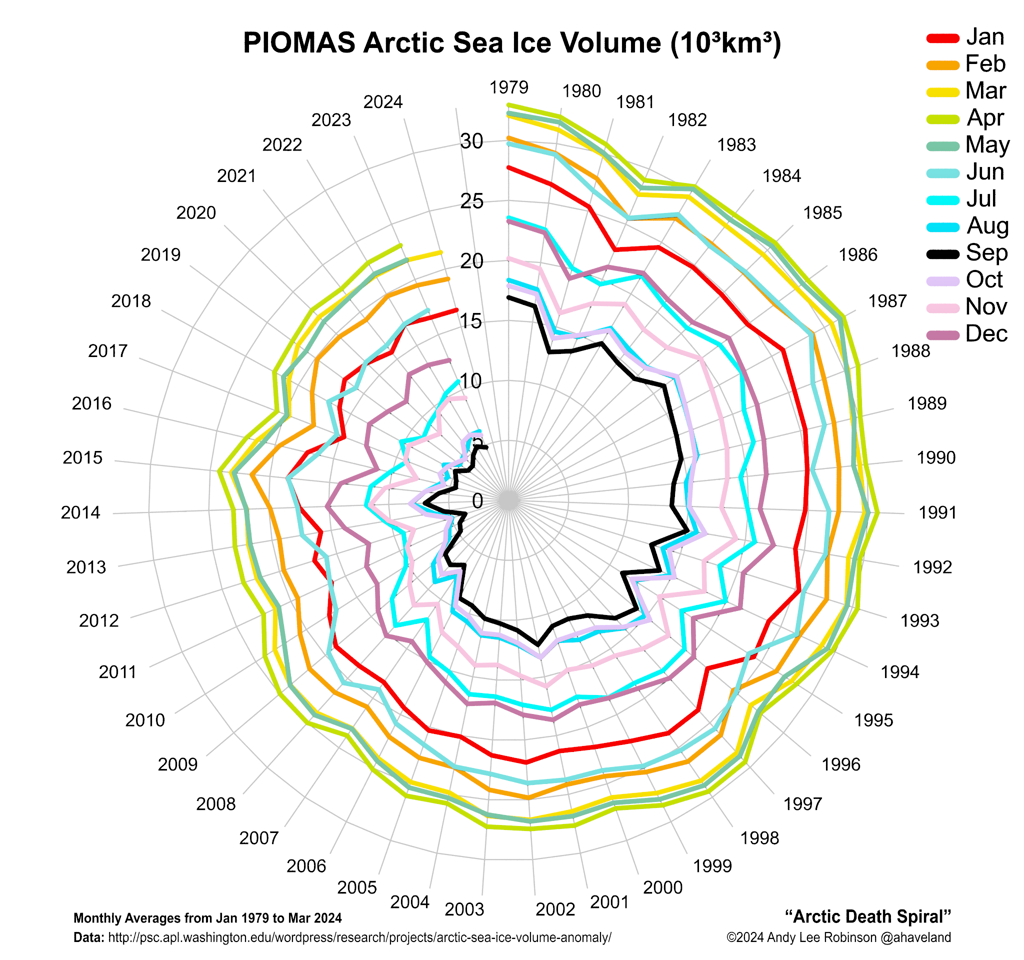
Above a tilted screenshot from the animation below, by Andy Lee Robinson, of Arctic Sea Ice minimum volumes reached every September since 1979, based on data from the Pan-Arctic Ice Ocean Modeling and Assimilation System (PIOMAS, Zhang and Rothrock, 2003) at the University of Washington.
Andy also composed and performed the piano music, "Ice Dreams", accompanying the video.
video from https://www.youtube.com/watch?v=YgiMBxaL19M
By Dorsi Diaz
Dorsi Diaz is a freelance writer and art educator living in the San Francisco Bay Area. Dorsi's passion is to help adults and children unlock their creativity and imagination and to also spread the word about the effects of world-wide climate change - follow Dorsi Diaz on Twitter
Below, Andy's Arctic Death Spiral video, with the sea ice volume data controlling spectral harmonics.
Added below is a video of another Arctic Death Spiral, accompanied by Chopin's 'Funeral March'. This work is not by Andy, it's from reric.org by R. Eric Collins.
 |
| Dorsi Diaz |
They say a picture can be worth a thousand words. If so, then this video of the Arctic Sea ice loss between 1979 and 2012 must be worth a million. As the recently released video begins to go viral, more people are waking up to the reality of climate change.
Produced by Andy Lee Robinson, this beautiful short clip with its haunting music is revealing the reality of climate change in a brutal and honest way - perhaps even better than any journalist ever could.
In an interview with Robinson, I was amazed at how he had managed to put together this vital information in such a compelling video, and sought to find out more.
To the climate deniers horror, Andy has done this video with no sort of compensation - dashing away climate deniers theories that all climate activists "are on the payroll." With hundreds of painstaking hours put into the development of his video, Andy says he was motivated by "experimenting with ideas and what ifs" and sought to "bring to life something that only existed in my mind to communicate an important message that is being ignored."
To create the video, he used a text editor, numbers and only his imagination to weave together the horrifying decline of Arctic sea ice that has occurred in just 13 short years.
Andy says one of the reasons for creating the video was, "to contribute something to humanity and be recognized for it, applying the skills I have learnt with my free time and not to live in vain" and also, "to prove that anyone can achieve anything they want to given enough determination and dedication."
With over 100 hours invested just into the writing of the program for the video, Andy also said it took 28 hours for 7 servers to render the final video, then about a half hour to write, record, edit and merge the music. The piano composition in the video, "Ice Dreams", was also composed by Andy, who also specializes in digital audio sampling and signal processing.
Robinson, a linux system administrator and consultant, has a passion to bring awareness about climate change to the masses and is adamant about what may happen if civilization does not address this growing threat: "We are in a period of mass extinction and heading for decimation of the quality of life for most lifeforms on the planet, including ourselves who are also subject to the laws of nature of boom and bust as resources are exploited and depleted."
Robinson also believes, with many others, that climate change and ocean acidification are, "planetary emergencies in progress."
Robinson doesn't mince any words either when asked why he created the video: "To be heard loudly and truthfully because mainstream media is still tiptoeing around the herd of elephants in the room because of the fear of change and the pressure of special interests committed to ensuring it stays that way, ignoring the fact that it cannot."
Until recently, climate deniers had dominated much of the political landscape and held a tight reign on the mainstream media. Now that climate change seems to be spiraling out of control with billions of dollars in weather related disasters, people are waking up to a preview of what it's like to live in a climate altered world.
Robinson's research for the video uses records of Arctic sea ice loss from PIOMAS through the Polar Ice Center, a group of dedicated investigators that conducts interdisciplinary research on the oceanography, climatology, meteorology, biology and ecology of the ice-covered regions on Earth and elsewhere in the solar system.
Through the perfect dance of loss and hauntingly beautiful music merged with pending disaster, Robinson has brought home a message in this video that we all need to heed: "Survival is not compulsory, nor a God given right. It requires effort, investment and cooperation."
Are we listening yet?
Dorsi Diaz is a freelance writer and art educator living in the San Francisco Bay Area. Dorsi's passion is to help adults and children unlock their creativity and imagination and to also spread the word about the effects of world-wide climate change - follow Dorsi Diaz on Twitter
Below, the Arctic Death Spiral, another visualization of the PIOMAS data by Andy Lee Robinson.
 |
| Andy's Arctic Death Spiral - update incl May 2013 - latest version at http://haveland.com/share/arctic-death-spiral.png |
Below, Andy's Arctic Death Spiral video, with the sea ice volume data controlling spectral harmonics.
Added below is a video of another Arctic Death Spiral, accompanied by Chopin's 'Funeral March'. This work is not by Andy, it's from reric.org by R. Eric Collins.