Tampilkan postingan dengan label Veli Albert Kallio. Tampilkan semua postingan

Sabtu, 22 Juni 2013

Open Water In Areas Around North Pole

In some areas around the North Pole, thickness of the sea ice has declined to virtually zero, i.e. open water.


What could have caused this open water? Let's go through some of the background.

North Hemisphere snow cover has been low for some time. Snow cover in May 2013 was the lowest on record for Eurasia. There now is very little snow left, as shown on the image right, adapted from the National Ice Center.

Low snow cover is causing more sunlight to be absorbed, rather than reflected back into space. As can be expected, there now are high surface temperatures in many areas, as illustrated by the NOAA image below. Anomalies can be very high in specific cases. Zyryanka, Siberia, recently recorded a high of 37.4 C, against normal high temperatures of 20 C to 21 C for this time of year. Heat wave conditions were also recorded in Alaska recently (satellite image of Alaska below).

NASA image June 17, 2013, credit: NASA/Jeff Schmaltz, LANCE MODIS Rapid Response Team, NASA GSFC - from caption by Adam Voiland: "Talkeetna, a town about 100 miles north of Anchorage, saw temperatures reach 96°F (36°C) on June 17. Other towns in southern Alaska set all-time record highs, including Cordova, Valez, and Seward. The high temperatures also helped fuel wildfires and hastened the breakup of sea ice in the Chukchi Sea."
Accordingly, a large amount of relatively warm water from rivers has flowed into the Arctic Ocean, in addition to warm water from the Atlantic and Pacific Oceans.


Sea surface temperatures have been anomalously high in many places around the edges of the sea ice, as also shown on the NOAA image below.


Nonetheless, as the above images also make clear, sea surface temperatures closer to the North Pole have until now remained at or below zero degrees Celsius, with sea ice cover appearing to remain in place. The webcam below from the North Pole Environmental Observatory shows that there still is a lot of ice, at least in some parts around the North Pole.

Webcam #2 of the North Pole Environmental Observatory monitoring UPMC's Atmospheric Buoy, June 21, 2013
So, what could have caused the sea ice to experience such a dramatic thickness decline in some areas close to the North Pole?

Firstly, as discussed in earlier posts, there has been strong cyclonic activity over the Arctic Ocean (see also Arctic Sea Ice blog post). This has made the sea ice more prone and vulnerable to the rapid decline that is now taking place in many areas.

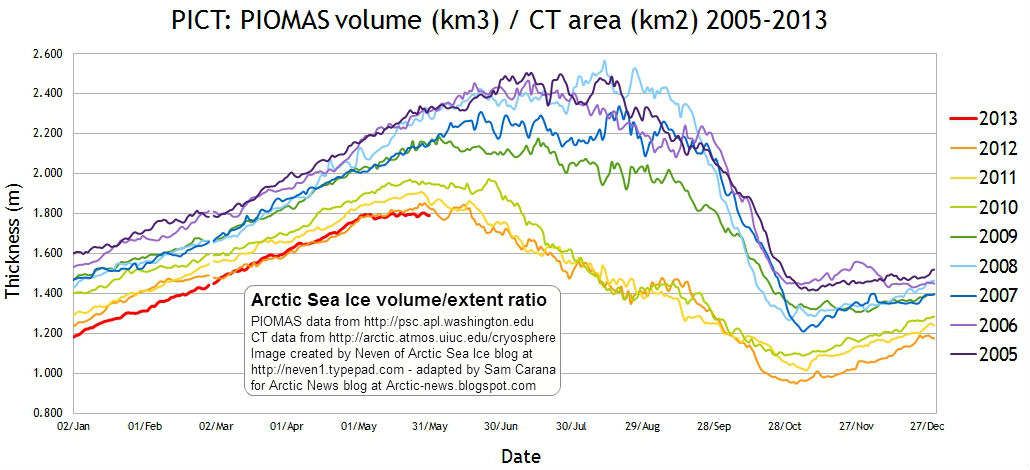
Furthermore, Arctic sea ice thickness is very low, as illustrated by the image below.

Arctic sea ice volume/extent ratio, adapted by Sam Carana from an image by Neven (click to enlarge)
Finally, there has been a lot of sunshine at the North Pole. At this time of year, insolation in the Arctic is at its highest. Solstice (June 20 or June 21, 2013, depending on time zone) is the day when the Arctic receives the most hours of sunlight, as Earth reaches its maximum axial tilt toward the sun of 23° 26'. In fact, insolation during the months June and July is higher in the Arctic than anywhere else on Earth, as shown on the image below.

Monthly insolation for selected latitudes -  adapted from Pidwirny, M. (2006), in "Earth-Sun Relationships and Insolation",  Fundamentals of Physical Geography, 2nd Edition
In conclusion, the current rapid sea ice thickness decline close to the North Pole is mostly due to a combination of earlier cyclonic activity and lots of sunlight, while the sea ice was already very thin to start with. The cyclone broke up the sea ice at the center of the Arctic Ocean, which is turn made it more prone to melting rapidly. The cyclone did more, though, as contributor to the Arctic-news blog Veli Albert Kallio explains:
"The ocean surface freezes if the temperature falls below -2.5C. The reason for the negative melting point is the presence of 4-5% of sea salt. Only in the polar regions does the sea surface cool sufficiently for sea ice to form during winters.

The sea ice cover is currently thinning near the North Pole between 80-90 degrees north. This part of the ocean is very deep. It receives heat of the Gulf Stream from the south: as the warm water vapourises, its salt content to water increases. This densifies the Gulf Stream which then falls onto the sea floor where it dissipates its heat to the overlying water column. The deep basin of the Arctic Ocean is now getting sufficiently warmed for the thin sea ice cover to thin on top of it. The transportation of heat to the icy surface is combined with the winds that push cold surface water down while rising heat to surface."
Indeed, vertical mixing of the water column was enhanced due to cyclonic activity, and this occurred especially in the parts of the Arctic Ocean that also are the deepest, as illustrated by the animation below.
Legend right: Ice thickness in m from Naval Research Laboratory
Legend bottom: Sea depth (blue) and land height (brown/green)
in m from NIBCAO Arctic map at NOAA
The compilation of images below shows how the decline of sea ice has taken place in a matter of weeks.

[ click to enlarge ]
This spells bad news for the future. It confirms earlier analyses (see links below) that the sea ice will disappear altogether within years. It shows that the sea ice is capable of breaking up abruptly, not only at the outer edges, but also at the center of the Arctic Ocean. As the Arctic sea ice keeps declining in thickness, it does indeed look set to break up and disappear abruptly across most of the Arctic Ocean within a few years. Models that are based on sea ice merely shrinking slowly from the outer edges inward should reconsider their projections accordingly.

Related

- Getting the Picture
http://arctic-news.blogspot.com/2012/08/getting-the-picture.html

- Supplementary evidence by Prof. Peter Wadhams
http://arctic-news.blogspot.com/2012/04/supplementary-evidence-by-prof-peter.html

Selasa, 18 Juni 2013

Mean Methane Levels reach 1800 ppb

On May 9, the daily mean concentration of carbon dioxide in the atmosphere of Mauna Loa, Hawaii, surpassed 400 parts per million (ppm) for the first time since measurements began in 1958. This is 120 ppm higher than pre-industrial peak levels. This unfortunate milestone was widely reported in the media.

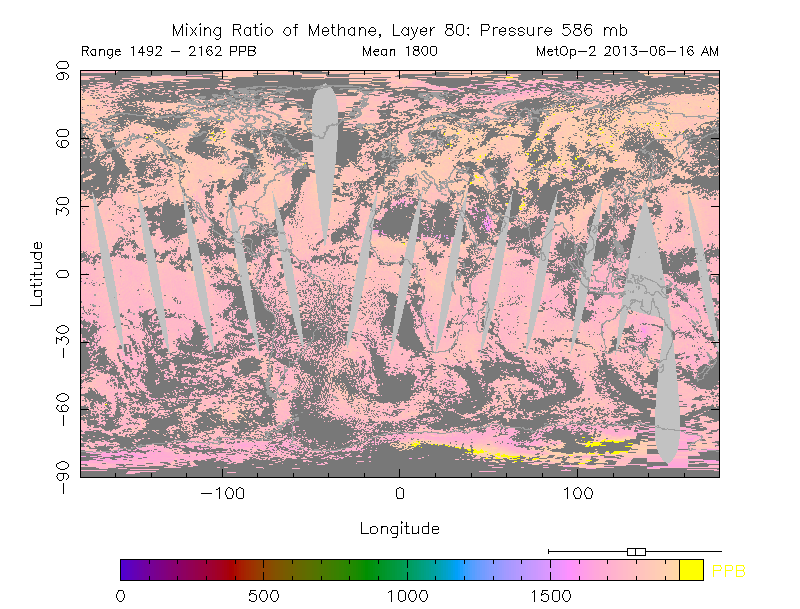
There's another milestone that looks even more threatening than the above one. On the morning of June 16, 2013, methane levels reached an average mean of 1800 parts per billion (ppb). This is more than 1100 ppb higher than levels reached in pre-industrial times (see graph further below).
NOAA image
Vostok ice core analysis shows that temperatures and levels of carbon dioxide and methane have all moved within narrow bands while remaining in sync with each other over the past 400,000 years. Carbon dioxide moved within a band with lower and upper boundaries of respectively 200 and 280 ppm. Methane moved within lower and upper boundaries of respectively 400 and 800 ppb.
Temperatures moved within lower and upper boundaries of respectively -8 and 2 degrees Celsius.

From a historic perspective, greenhouse gas levels have risen abruptly to unprecedented levels. While already at a historic peak, humans have caused emissions of additional greenhouse gases. There's no doubt that such greenhouse gas levels will lead to huge rises in temperatures. The question is how long it will take for temperatures to catch up and rise.


Below is another way of looking at the hockey stick. And of course, further emissions could be added as well, such as nitrous oxide and soot.


Large releases of methane must have taken place numerous times in history, as evidenced by numerous pockmarks, as large as 11 km (6.8 mi) wide.

Importantly, large methane releases in the past did not result in runaway global warming for a number of reasons:
  • methane release typically took place gradually over many years, each time allowing a large release of methane to be broken down naturally over the years before another one occurred. 
  • Where high levels of methane in the atmosphere persisted and caused a lot of heat to be trapped, this heat could still be coped with due to greater presence of ice acting as a buffer and consuming the heat before it could escalate into runaway temperature rises.
Wikipedia image
Veli Albert Kallio comments:

The problem with ice cores is that if there is too sudden methane surge, then the climate warms very rapidly. This then results the glacier surfaces melting away and the ice core begins to loose regressively surface data if there is too much methane in the air.

Because of this, there has been previous occurrences of high methane, and these were instrumental to bring the ice ages ice sheets to end (Euan Nisbet's Royal Society paper). The key to this is to look at some key anomalies and devise the right experiments to test the hypothesis for methane eruptions as the period to ice ages.

Thus, the current methane melting and 1800 ppm rise is nothing new except that there are no huge Pleistocene glaciers to cool the Arctic Ocean if methane goes to overdrive this time. In fact methane may have been many times higher than that but all surface ice kept melting away and staying regressive until cold water and ice from destabilised ice sheets stopped the supply of methane (it decays fast if supply is cut and temperatures fall back rapidly when seas rose).

The Laurentide Ice Sheet alone was equivalent of 25 Greenland Ice Sheets and the Weischelian and other sheets on top of that. So, the glaciers do not act the same way as fireman to extinguish methane. Runaway global warming is now possibility if the Arctic loses its methane holding capability due to warming.

Further discussion is invited on the following points:
  • The large carbon-12 emission anomalies in East Asian historical objects that are dateable by historical knowledge. Discussion about the explanations concocted and why methane emission from permafrost soils and sea beds must be the answer; 
  • the much overlooked fact that if there were ever very highly elevated concentrations of air in the Arctic, this would induce strong melting of glaciers which then lack those surface depositions where the air were most CH4 and CO2 laden. Even moderate levels of temperature rise damaged Larsen A, Larsen B, Petermann and Ellesmere glaciers. If huge runaway outgassing came out when Beringia flipped into soil warming, then methane came out really large amounts with CO2.
  • Discussion of the experiments how to compensate for the possible lack of "time" in methane elevated periods in the ice cores by alternative experiments to obtain daily, weekly, monthly and yearly emission rates of CH4 and CO2 from the Last Glacial Maximum to the Holocene Thermal Maximum (as daily, weekly, monthly, and yearly sampling of air).

Editor's update: Methane levels go up and down with the seasons, and differ by altitude. As above post shows, mean levels reached 1800 ppb in May 2013 at 586 mb, according to MetOp-2 data. Note that IPCC AR5 gives levels of 1798 ppb in 2010 and 1803 ppb in 2011, as further discussed in later posts such as this one. Also, see historic data as supplied by NOAA below.


Kamis, 06 Juni 2013

Thin Spots developing in Arctic Sea Ice

From the start of 2013, Arctic sea ice extent has roughly followed the same path it did in 2012 when a historic record low was reached, as discussed in a previous post. At the moment, thinner spots are developing in the sea ice, as illustrated by the image below.


These thin spots are developing due to a combination of factors:
  • a cyclone over the Arctic
  • low North Hemisphere snow cover causing more sunlight to be absorbed, rather than reflected back into space
  • warm sea surface temperatures at edges of sea ice, as illustrated by the image below
  • ice thickness is very low, as illustrated by the image further below
NOAA image, click to enlarge
Arctic sea ice volume/extent ratio by Neven (click to enlarge image)
Below, a 30-day Naval Research Laboratory animation illustrating the development of the thinner spots. 

For the most updated version of this animation, click here
For years, observation-based projections have been warning that Arctic sea ice will disappear within years, with dire consequences not only for the Arctic, but for the world at large. Hopefully, more people will realize the urgency of the situation and realize the need for a comprehensive and effective plan of action as described here

Image adapted from TheCryosphereToday by Albert Kallio, contributor to the Arctic-news blog
Albert Kallio comments:
"NORTH POLE STORM IN MAY / JUNE 2013 AND SEA ICE SHATTERING AND COMPACTION 06/06/2013

Due to a constant thinning of the Arctic Ocean ice cover it has become sensitive to shearing by ocean wave penetration, winds and ocean currents. As a result of this weakening, a relatively small but persistent storm that centred over the North Pole managed to shatter 75%, or three quarters of Arctic Ocean's ice cover into free ice floes.

Because of the earth's spin, winds and ocean currents, the North Pole immediacy saw vast leads opening in colossal numbers, lots of broaken ice has migrated towards the Atlantic Ocean via the Fram Strait, the Barents and Kara Seas.

The situation is opposite on the Pacific Ocean end of the Arctic Ocean where ice cannot escape further south due to Eurasian and North American land barrier blocking further southward ice movements. These areas have seen densification of sea ice as the broken ice has packed against the Arctic Ocean’s perimeter coastlines.

The Arctic Ice Cover break up is a dangerous situation because the insolation (sunlight amount) and heat carryover from the continent (currently snow free) is the greatest on perimeter in far south (the Bering Strait).

The 06/06/2013 situation is suggestive that:

(1.) The high Arctic Basin will face aggressive melting as sunlight pours into the open leads of dark water, leading to opening of this part of the ocean early.

(2.) The compaction zone in Alaska will later follow the suit as the ice gets pushed against the warm coastal seas.

(3.) Despite good (near 100%) ice cover, on the compaction zone, the ice will melt also here as the heat carry over from the continent (south) is here the greatest.

(4.) The sunlight amount and the length of the annual melt season are the greatest in the far perimeters of the Arctic Ocean (around the Bering Strait).

(5.) The brokenness of sea ice cover into countless ice floes increases its three dimensional surface area in water which helps the transmission of heat from the sea water into ice. Sea water retains large thermal inertia (capacity to store heat. This melts ice when the warm sea water gets in contact with sea ice’s frozen surfaces).

(6.) Where leads occur within ice, a strong vertical mixing of sea water also increases melting.

(7.) The brokenness of North Pole’s ice cover and its reduced ice amount reduces the sea ice congestion (gridlock) making it much easier to escape to the Atlantic Ocean via the Fram Strait, the Barents and Kara Seas." 
Image adapted from University of Bremen by Albert Kallio, contributor to the Arctic-news blog
Albert Kallio, commenting on above image:
BREAK UP OF NORTH POLE SEA ICE CAP AS AT 9TH JUNE 2013

The Arctic Ocean ice cover has broken up unexpectedly early and the sea ice is particularly shattered in the viscinity of the North Pole posing huge uncertainties how the sea ice (and the polar bears, walruses and seals on it) can survive until autumn. The dark violet represents good, solid sea ice cover. The more coloured, the more shattered and reduced the sea ice cover is.

Paul Beckwith adds (extracted from Paul's June 10, 2013, blogpost  Why Arctic sea ice will vanish in 2013):
Within the last few weeks, cyclonic activity has returned and once again caused substantial thinning and weakening of the sea ice near the North Pole. Ice near the center of cyclonic activity, recently 2 to 2.5 metres thick, has thinned to roughly 1.25 metres. This in less than 2 weeks: unprecedented so early in the melt season. More significantly, in the last few days a gaping “hole” has appeared in the much thicker ice just north of the Canadian Arctic Archipelago. Ice that was recently 3.5 to 4 metres thick is now less than 2 metres thick in the hole.

The hole is likely due to a combination of divergence of the ice away from the rotating cyclone center, and the upwelling (churning up) of warm, salty sea water below. The most rapid melting and ice deterioration is occurring below the surface (where the cold surface air temperature can’t slow melting).

The magnitude of the most recent cyclonic activity is not unusual, although the persistence is. What is also new in the equation is the ability of these common cyclones to degrade the ice, and do so very early in the melt season. Also new is the substantial increase in amplitude, frequency and duration of cyclonic activity in the Arctic Ocean basin. The thinning ice cover not only breaks up easier now (even by relatively small and weak cyclones), more open water leads to an increase in melting and storm intensity.

It’s for all these reasons I find it extremely difficult to comprehend how any sea ice will be left after this year’s summer ‘melt season’.
Below, Paul Beckwith's animation Arctic sea ice thickness + motion June 10 2013, based on Naval Research Laboratory data.

Rabu, 05 Desember 2012

Arctic anomalies linked to extreme weather

Surface temperature anomalies of 20 degrees Celsius are not uncommon in the Arctic these days. The image below shows surface temperature anomalies on November 9 and 10, 2012.


Paul Beckwith, regular contributor to this blog, comments as follows on the conditions in the Arctic:
“The Arctic meteorology is unprecedented at the moment. Huge ridges of high pressure are crossing the Arctic ocean cutting off the Siberian cold region from the North American region. Very little cold air is present in the entire system, and it is exhibiting very bizzare fragmentation. Nothing like a “normal” polar vortex is apparent.

The ridge could just be due to this greatly reduced volume of cold air, but I suspect there is much more to the situation then that. It seems that there must be some source of heat to create this ridge. Could be warm air rising up from open water regions in the Arctic, however most of the warm water is now isolated from the atmosphere by the sea ice.

It seems more likely to me that the high levels of methane with GWP > 150 or higher are causing higher long-wave absorption and heating in these regions, but I have not seen methane concentration distributions over the Arctic from AIRS satellites lately.”
So, let's have a look at the methane levels for those days. The image below shows the methane levels for the above two days.


Paul continues:
“This is what abrupt climate change looks like. In the paleorecords global average temperatures increased over 6 degrees C within a decade or two, I suppose we will know more precise numbers in a few short years.”

Paul repeats the prediction he made back in June in this the post When the sea ice is gone
Paul Beckwith, B.Eng, M.Sc. (Physics),
Ph. D. student (Climatology) and
Part-time Professor, University of Ottawa
My projections for our planet conditions when the sea-ice has all vanished year round (PIOMAS graph projects about 2024 for this; I forecast 2020 for this) are:
  • Average global temperature: 22°C (+/- 1°C)
    (rise of 6-8°C above present day value of about 15°C)
  • Average equatorial temperature: 32°C
    (rise of 2 °C above present day value of 30°C)
  • Average Arctic pole temperature: 10°C
    (rise of 30°C above present day value of -20°C)
  • Average Antarctica pole temperature: -46°C
    (rise of 4°C above present day value of -50°C)
  • Water vapor in atmosphere: higher by 50%
    (rise of 4% over last 30 years, i.e. about 1.33% rise per decade)
  • Average temperature gradient from equator to North pole: 22°C
    (decrease of 28°C versus present day value of 50°C)
  • Very weak jet streams (driven by N-S humidity gradient and weak temperature gradient as opposed to existing large temperature gradient)

- Result: very fragmented, disjointed weather systems
- Basic weather: tropical rainforest like in some regions; arid deserts in others with few regions in between.

Note: This scenario would require significant emissions of methane from the Arctic. Without this methane, the scenario would still occur but would take longer. Disclaimer: Best guess and subject to rolling revisions!

Meanwhile, extreme weather continues to strike areas outside the Arctic. In the U.K, airports were closed due to snow, following a period of heavy rainfall in November.

In Russia, extreme weather caused a huge traffic jam; see the BBC reports here and here, prompting Veli Albert Kallio, also one of this blog's contributors, to make the following comments:
Veli Albert Kallio in front of Peter Wadhams and John Nissen at
APPCCG event, March 13, 2012, House of Commons, London
“The Ewing-Dunn Precipitation (the lake-effect snow) from warmed-up Arctic Ocean has taken the Russian Government's winter preparations by suprise of its severity, with the Russian Government minister banging his fist as standing queues of vehicles reoccurs and is now 190 kilometres (120 miles) long between the capital Moscow and St. Petersburg.

I have been warning from the leaked files since July at this and other groups that December 2012 was going to be like this. We need to tell the Russian Interior Minister who bangs his fist on TV that he should not blame his road officials, but the global warming and loss of sea ice from the Barents and Kara Seas and generally warmed up North Atlantic - Arctic Ocean regions.”

Sabtu, 25 Agustus 2012

Future of Arctic Ice: The Three Perspectives

By Veli Albert Kallio
Veli Albert Kallio in front of Peter Wadhams and John Nissen at
APPCCG event, March 13, 2012, House of Commons, London


I use three type sources to assess climate:
  1. the peer-reviewed literature and news reports; 
  2. the whistle-blower organisations (Wikileaks, Cialeaks that release data files from the US Army, Navy, Air Force, CIA, the US State Department, or intercepted corporate telephone or Internet communications; and 
  3. indigenous people’s organisations and their ethnoclimatology people.

June 26, 2012: the Cialeaks released data files from the US stating that the North Pole will be ice free in 2013. These appear to be submarine upward sonar readings of ice from the US Navy. These contrast strongly what NSIDC is saying about the sea ice surviving much longer. I do not know the reason why US Navy and NSIDC advice differently on this point (an exponential trend projection based on PIOMAS data gives zero-ice 2015).

As per the question, where all heat goes after the sea ice has melted, I stick to the advice given in the United Nations General Assembly motion 101292: the Polar Ice responds extremely fast: first the sea ice melts and disintegrates, then followed by intense methane surges and equally rapid losses of the Arctic terrestrial ice cover in Greenland which never melts, but collapses instead.

After the sea ice loss, the permafrost and Greenland Ice Sheet take up a large portion of that energy that was previously used to melt the sea ice during the short summers. As a result, the ocean warms up and rains much more water than now with the flash-floods becoming very frequent in Greenland. As a result many times more water appears on top of Greenland’s Ice Sheet.

Greenland Ice Sheet rapidly metamorphoses from a (cold, dry, stable) moraine-forming ice sheet into a (warm, wet, dynamic) aggregate-forming ice sheet as the water amount within ice sheet and at its base increase. The bottom part of the ice sheet turns increasingly into water-logged, “mushy” ice that loses its internal strength, while pot holes on bedrocks become filled by water.

By 2020's 1/3 of Greenland Ice Sheet's base (between ice and bedrock) is dotted with water ponds at which point the rapid erosion processes (cavitation, plucking and kolking) pulverise the ice so aggressively that an "ice sheet thrust" develops against coastal perimeter at Melville Bay area. Even the dry parts of ice sheet then no longer can hold the ice dome in place and Heindrich Ice Berg Calving Event (H-1) occurs.

After the Heindrich Minus One (H-1) event the North Atlantic Ocean between America and Europe fills by broken ice that triggers a near-instantaneous severe climate cooling: the Last Dryas. Europe will see many years lasting freeze with Dryas Octopetala rapidly taking hold across continent's then barren soils. The ice volume is 10 times less in Greenland than in a similar event when the Hudson Bay Ice Dome reminders collapsed.

This ice evolution history of the First Nations of Americas as expressed on the UN General Assembly motion 101292 and the Plantagon Declarations, were used on the global-warming themed film “A Day After Tomorrow” and also “2012” by director Roland Emmerlich. Unfortunately, the films assigned incorrect physics and caused great annoyance among the Native American Indian communities due to many other inaccuracies in details therein:

“2012” films ‘mystery radiation of sun’ was never caused by neutrinos, but methane: the Bøllinger Years. The ‘core melting’ was due to the displacement of asthenosphere’s fluids as the heavy Foxe-Laurentide Ice Dome destabilised forcing the liquid minerals in asthenosphere to move out of way, the pressures causing huge eruptions and lava floods (asthenosphere is like a “wet sponge”, a composite of solid and liquid minerals).

“A Day After Tomorrow’s freeze failed the Boyle’s Law: ultra-cold stratosphere cannot fall, and cause instantaneous sea level jump that was followed by the Younger Dryas freeze-up, but ice can.

The First Nations of Americas have raised the alarm very clearly continuously for the last 20 years since the first Rio de Janeiro summit in 1992 that the West is living in delusions (including its scientists). Just like the perimeter between the south tip of the Baffin Island and the north tip of Newfoundland once failed, ending the Ice Ages, the rapid melt water accumulation same way destroys now Greenland’s perimeter barrier at Melville Bay. Wet solidus damage causing lava floods and inlet fjord leaks can suddenly speed it up even more unpredictably.

Here is Professor Oren Lyon Jr.’s (Native American Tradition-Keeper and Historian of the Six Nations who worked at the University of Buffalo), the Internet summary of the Plantagon Declarations: http://www.youtube.com/watch?v=4OjjPETcz6A

There is no point just to observe and repeat only points that appear in the professional literature. I want other communities’ perspectives and wisdom to be also realised and acknowledged:

+ either: the ancient experiences of the ancient people,

+ or: for the huge risks that people take to uncover often illegal practises by the corporations who are often acting in tacit co-operation with government officials, scientists or industrialists who are hostile to admit publically the role of greenhouse gases that violate their pet paradigm that the economic growth can be based on infinite growth from fossil-fuelled supply of goods and services.

Veli Albert Kallio, FRGS
International Guru Nanak Peace Prize Nominee for 2008;
sea level rise risk for global security & economic stability.