Tampilkan postingan dengan label carbon dioxide. Tampilkan semua postingan

Minggu, 26 Oktober 2014

Ocean Temperature Rise

Ocean Temperatures

Of all excess heat resulting from people's emissions, 93.4% goes into oceans. Accordingly, the temperature of oceans has risen substantially.

Globally, the average September ocean temperature marked a record high for that month in 2014, at 0.66°C (1.19°F) above the 20th century average, breaking the previous record that was set just one month earlier. On the Northern Hemisphere, the temperature of the ocean in September 2014 was 0.83 °C (or 1.49 °F) above the 20th century, 


The anomaly was 0.84 °C in August 2014, as illustrated by the image below.

On specific days, anomalies were much higher. On August 19, 2014, the Northern Hemisphere showed a sea surface temperature anomaly of 1.78 °C, while the North Atlantic sea surface temperature was 1.82 °C above average (CFSR 1979-2000 Baseline) on October 16, 2014, as illustrated by the image below.


Sea surface temperature anomalies are at the top end of the scale in many places in the Arctic, as well as off the coast of North America. The danger is that the Gulf Stream will keep carrying ever warmer water from the North Atlantic into the Arctic Ocean, threatening to unleash huge methane eruptions from the Arctic Ocean's seafloor, in turn causing even higher temperatures and more extreme weather events, wildfires, etc.


Above image shows methane levels as high as 2666 ppb, as measured by the MetOp-2 Satellite at 14,385 ft (~4.4 km) altitude on October 26, 2014 am.

Is 2666 ppb as high as it will get?

Sadly, methane releases from the seafloor of the Arctic Ocean are becoming increasingly larger around this time of year and they look set to get even larger than this. Note that the amount of methane actually erupting from the seafloor of the Arctic Ocean is even larger than what is visible on above image, for the following three reasons.

  1. No data were available for some areas, as the IASI (Infrared Atmospheric Sounding Interferometer) instrument measuring methane only covers a certain width. The white shapes showing up on above images are areas where no measurements were taken, resulting from the way the polar-orbiting satellite circum-navigates the globe, as pictured on the image on the right.

    Furthermore, quality control failed in the grey areas on above images, indicating reading difficulties due to high moisture levels (i.e. snow, rain or water vapor), as also discussed in an earlier post. Accordingly, high methane levels (above 1950 ppb) as show up in the yellow areas could also be present in the many grey areas over the Arctic Ocean.

    When also looking at methane levels on days following the high 2666 ppb reading, methane is persistently present over most of the Arctic Ocean, as illustrated by the above October 29, 2014, combination image, confirming that high methane levels were likely present in areas where no data were available on October 6, 2014.
       
  2. Much of the methane that is released from the Arctic Ocean's seafloor is broken down by microbes as it rises up in the water. The SWERUS-3 research team recently found methane in the waters of the East Siberian Sea at levels that equate to atmospheric levels of  3188 ppb.
       
  3. Much methane is broken down in the atmosphere by hydroxyl, as illustrated by the image below, showing carbon dioxde levels on October 27, 2014, that indicate that large amounts of methane are broken down at higher latitudes on the Northern Hemisphere.

The latter point could explain the sudden recent rise in carbon dioxide levels, as also detected at Mauna Loa, Hawaii, as illustrated by the image below.


In conclusion, the amount of methane that is erupting from the seafloor of the Arctic Ocean is larger than what is visible on satellite images, and the water will be highly saturated with methane at locations where the methane is escaping from the seafloor, highlighting the danger that, in case of large abrupt releases from the Arctic Ocean's seafloor, microbes and hydroxyl will quickly get depleted locally, resulting in little of the methane being broken down, as discussed at an earlier post.

Why are such huge amounts of methane starting to get released from the Arctic Ocean's seafloor now?  

As the image below shows, temperature at 2 meters was below 0°C (32°F, i.e. the temperature at which water freezes) over most of the Arctic Ocean on October 26, 2014. The Arctic was over 6°F (3.34°C) warmer than average, and at places was up to 20°C (36°F) warmer than average.


Above image illustrates the enormous amount of heat that has until now been transferred from the waters of the Arctic Ocean to the atmosphere. Underneath the surface, water temperatures are much higher than they used to be and, as around this time of year the Arctic Ocean freezes over, less heat will from now on be able to escape to the atmosphere. Sealed off from the atmosphere by sea ice, greater mixing of heat in the water will occur down to the seafloor of the Arctic Ocean.

As land around the Arctic Ocean freezes over, less fresh water will flow from rivers into the Arctic Ocean. As a result, the salt content of the Arctic Ocean increases, making it easier for ice in cracks and passages in sediments at the seafloor of the Arctic Ocean to melt, allowing methane contained in the sediment to escape. Furthermore, the sea ice makes that less moisture evaporates from the water, which together with the change of seasons results in lower hydroxyl levels at the higher latitudes of the Northern Hemisphere, in turn resulting in less methane being broken down in the atmosphere over the Arctic.

This situation will continue for months to come. Salty and warm water (i.e. warmer than water that is present in the Arctic Ocean) will continue to be carried by the Gulf Stream into the Arctic Ocean, while less heat and moisture will be able to be transferred to the atmosphere.

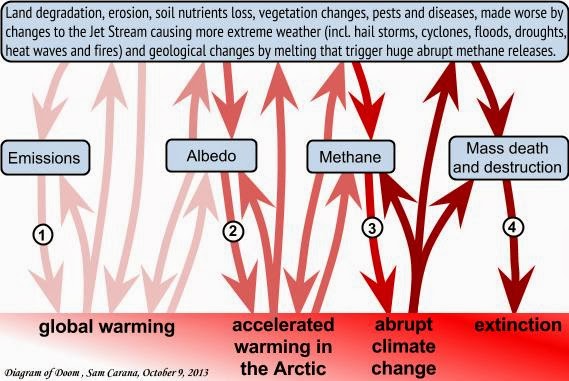
In conclusion, high methane levels threaten to further accelerate warming in the Arctic, in a vicious cycle escalating into runaway warming and resulting in death, destruction and extinction at massive scale.

So, what can be done to reduce the risk?

Climate Plan

- Emission Cuts

It is imperative that large emissions cuts are made quickly. The Climate Plan calls for 80% emission cuts by 2020, as one of multiple lines of action that need to be implemented in parallel.

- Greenhouse Gas Removal and Storage

The IPCC points at the need for carbon dioxide removal and also warns about ocean warming continuing for centuries (text below).


Indeed, even if all emissions by people could somehow be brought to an abrupt end, this alone will not stop the rise of ocean temperatures, at least not for a long time. For starters, air temperatures would start rising within days, in response to the disappearance of aerosols that now mask the full wrath of global warming. Furthermore, such a temperature rise would further accelerate feedbacks such as snow and ice decline, methane hydrate destabilization, etc., in turn feeding further temperature rises.

The Climate Plan therefore calls for carbon dioxide removal, as well as for active removal of other greenhouse gases from the atmosphere, and for further lines of action.

- Further Action

Again, merely implementing the above lines of action will not suffice to quickly bring down ocean temperatures. Paleo-climate records show that falls in temperature go hand in hand with falls of carbon dioxide in the atmosphere to levels under 280 ppm, as opposed to current carbon dioxide levels that are around 400 ppm.


Raising Funding for Further Action

The Climate Plan calls for comprehensive and effective action that includes additional lines of action. Such additional action will require U.N. supervision, which may make it hard for the necessary action to obtain sufficient funding.

In earlier posts, it was suggested that, besides having fees imposed on facilities that burn fossil fuel and on sales of fossil fuel itself, additional fees could be imposed on commercial international flights. As long as it seems too hard to substantially reduce emissions associated with such flights, it seems appropriate to explore further ways to minimize such flights, e.g. by imposing additional fees that could help fund further action.

There are a number of ways such fees could be implemented. Such fees could be calculated based on the distance traveled or as a percentage of the fare.

Fees could also be calculated on the basis of the traveler's flying history, e.g. in the form of frequent flyer fees. Such fees could be collected either by the respective airline or airport.

In the box on the right, Ekta Kalra gives further details about how the latter idea could be implemented.

What do you think?


References and related posts

- Four Hiroshima bombs a second: how we imagine climate change
http://arctic-news.blogspot.com/2013/08/four-hiroshima-bombs-second-how-we-imagine-climate-change.html

- Arctic Methane Release and Rapid Temperature Rise are interlinked
http://arctic-news.blogspot.com/2013/11/arctic-methane-release-and-rapid-temperature-rise-are-interlinked.html

- Climate Change Accelerating
http://arctic-news.blogspot.com/2014/10/climate-change-accelerating.html

- NOAA, Global Analysis - September 2014
http://www.ncdc.noaa.gov/sotc/global/2014/9

- NOAA Ocean temperature anomalies
http://www.ncdc.noaa.gov/cag/time-series

- Methane Hydrates
http://methane-hydrates.blogspot.com/2013/04/methane-hydrates.html

- Climate Plan
http://climateplan.blogspot.com


Jumat, 04 Juli 2014

Climate Plan

This image sums up the lines of action, to be implemented in parallel and as soon as possible, and targets of the Climate Plan, in order to avoid climate catastrophe.

The Climate Plan and its various parts have been discussed in many post at Arctic-news blog over the years.

Now is the time to support the Climate Plan and to make sure that it will be considered at many forums, such as the Climate Summit, to be held September 23, 2014, at the U.N. Headquarters in New York, and preparations for the UNFCCC Climate Change Conference in Paris in 2015.

Please show your support by sharing this text and the image widely!


Emission cuts

In nations with both federal and state governments such as the U.S., the President (or Head of State or Cabinet, basically where executive powers are held) can direct:
  • federal departments and agencies to reduce their emissions for each type of pollutant annually by a set percentage, say, CO2 and CH4 by 10%, and HFCs, N2O and soot by higher percentages.
  • the federal Environmental Protection Agency (EPA) to make states each achieve those same reductions. 
  • Target: 80% cut everywhere for each type of pollutant
    by 2020 (to be managed locally provided targets are met)
  • the EPA to monitor progress by states and to step in with more effective action in case a state looks set to miss one or more targets.
    (More effective action in such a case would be to impose (federal) fees on applicable polluting products sold in the respective state, with revenues used for federal benefits. Such federal benefits could include building interstate High-Speed Rail tracks, adaptation and conservation measures, management of national parks, R&D into batteries, ways to vegetate deserts and other land use measurements, all at the discretion of the EPA. Fees can be roughly calculated as the average of fees that other states impose in successful efforts to meet their targets.)
Similar policies could be adopted elsewhere in the world, and each nation could similarly delegate responsibilities to states, provinces and further down to local communities.

Carbon dioxide removal and storage
Target: restore atmosphere and ocean to long term average
by 2100 (with each nation's annual contributions to reflect
its past emissions)

Energy feebates can best clean up energy, while other feebates (such as pictured in the above diagram) can best raise revenue for carbon dioxide removal. Energy feebates can phase themselves out, completing the necessary shift to clean energy within a decade. Carbon dioxide removal will need to continue for much longer, so funding will need to be raised from other sources, such as sales of livestock products, nitrogen fertilizers and Portland cement.

A range of methods to remove carbon dioxide would be eligible for funding under such feebates. To be eligible for rebates, methods merely need to be safe and remove carbon dioxide.

There are methods to remove carbon dioxide from the atmosphere and/or from the oceans. Rebates favor methods that also have commercial viability. In case of enhanced weathering, this will favor production of building materials, road pavement, etc. Such methods could include water desalination and pumping of water into deserts, in efforts to achieve more vegetation growth. Selling a forest where once was a desert could similarly attract rebates.

Some methods will be immediately viable, such as afforestation and biochar. It may take some time for methods such as enhanced weathering to become economically viable, but when they do, they can take over where afforestation has exhausted its potential to get carbon dioxide back to 280ppm.

Additionally, conservation and land use measures could help increase carbon storage in ecosystems.

Solar radiation management

Target: prevent Arctic Ocean from warming by more
than 1°C above long term average (U.N. supervised)
Apart from action to move to a more sustainable economy, additional lines of action are necessary to reduce the danger of runaway global warming.

Extra fees on international commercial aviation could provide funding for ways to avoid that the temperature of the atmosphere or the oceans will rise by more than 1°C above long term average.

Due to their potential impact across borders, these additional lines of action will need ongoing research, international agreement and cooperation.

Land, clouds, wind, water, snow and ice management

Target: increase Arctic snow and ice cover (U.N.
supervised) and restore it to its long term average 
Apart from action to move to a more sustainable economy, additional lines of action are necessary to reduce the danger of runaway global warming.

Extra fees on international commercial aviation could also provide funding for ways to cool the Arctic and restore the snow and ice cover to its long term average extent.

As said, due to their potential impact across borders, these additional lines of action will need ongoing research, international agreement and cooperation.

Methane management and further action

Target: relocate vulnerable Arctic clathrates (U.N. supervised)
and restore mean atmospheric CH4 level to long term average
by 2100 (with each nation's annual contributions to reflect its
past emissions.
Further action is needed to avoid that huge quantities of methane will abruptly erupt from the seafloor of the Arctic Ocean.

Vulnerable hydrates should be considered to be relocated under U.N. supervision.

Besides this, local action can be taken to reduce methane levels in the atmosphere with each nation's annual contributions to reflect its past emissions.

Adaptation, conservation and land use measures could further improve the situation.

The comprehensive and effective action of the Climate Plan will reduce the threat of runaway warming, and this will have obvious benefits for the environment and for species threatened with extiction.

Besides this, this will also save people money, will improve people's health and safety, will increase security of food and fresh water supply, will make energy supply and the electric grid more efficient, safe, robust and reliable, will reduce perceived needs for military forces to police fuel supply lines globally, and will create numerous local job and investment opportunities.


Please support, follow and discuss the Climate Plan at facebook.com/ClimatePlan and at ClimatePlan.blogspot.com


Selasa, 08 Oktober 2013

Abrupt Climate Change

What is Abrupt Climate Change?

Abrupt climate change is defined by the IPCC as a large-scale change in the climate system that takes place over a few decades or less, persists (or is anticipated to persist) for at least a few decades, and causes substantial disruptions in human and natural systems.

Examples of components susceptible to such abrupt change are clathrate methane release, tropical and boreal forest dieback, disappearance of summer sea ice in the Arctic Ocean, long-term drought and monsoonal circulation.

Deposits of methane clathrates below the sea floor are susceptible to destabilization via ocean warming.

Anthropogenic warming will very likely lead to enhanced methane emissions from both terrestrial and oceanic clathrates.

Above extracted from:
- Intergovenmental Panel on Climate Change (IPCC), AR5 Workgroup 1, Technical Summary

New Finding Shows Climate Change Can Happen in a Geological Instant

The Paleocene/Eocene thermal maximum (PETM) is a climate shift that occurred 55 million years ago.

James Wright, Rutgers University Research News -
Morgan Schaller, James Wright, and the core sample
that helped them understand what happened
– and how fast it happened – 55 million years ago.
In a new paper in the Proceedings of the National Academy of Sciences, Morgan Schaller and James Wright present their finding that climate change can and did happen abruptly, or in geological terms, instantaneously.

Following a doubling in carbon dioxide levels, the surface of the ocean turned acidic over a period of weeks or months and global temperatures rose by 5 degrees centigrade – all in the space of about 13 years.

“We’ve shown unequivocally what happens when CO2 increases dramatically – as it is now, and as it did 55 million years ago,” James Wright said.

The film below goes into more detail regarding the current situation.

New Film: Last Hours

The film “Last Hours” describes a science-based climate scenario where a tipping point to runaway climate change is triggered by massive releases of frozen methane. Methane, a powerful greenhouse gas, has already started to percolate into the open seas and atmosphere from methane hydrate deposits beneath melting arctic ice, from the warming northern-hemisphere tundra, and from worldwide continental-shelf undersea methane pools.

“Last Hours” is narrated by Thom Hartmann and directed by Leila Conners. Executive Producers are George DiCaprio and Earl Katz.


For more, also watch some of Thom Hartmann’s interviews.

High Methane Levels persist over Arctic Ocean

High methane levels are prominent over the Arctic Ocean, as illustrated by the image below, covering a period from October 3, 2013, 10:54 am to October 7, 2013, 11:53 pm. The fact that methane has not been present elsewhere in such high concentrations over this period indicates that the methane wasn't carried there by the wind from elsewhere. Also, methane typically appears to move along the same latitude, due to the Coriolis effect.


The image indicates a link between seismic activity and destabilization of methane that is held in sediments under the Arctic Ocean. Methane does show up prominently along the fault line that crosses the Arctic Ocean and extends into Siberia over the Laptev Sea.

The Diagram that IPCC failed to include in AR5

The diagram below shows global warming evolving into accelerated warming in the Arctic. Feedbacks such as albedo changes and methane release speed up this process, triggering abrupt climate change and finally extinction.

The Diagram the IPCC failed to include in AR5

This threatening situation calls for an Effective and Comprehensive Climate Plan, such as depicted by the green lines of action in the image below and as further described at the ClimatePlan blog. For more background, see related posts further below.


Related posts

- Just do NOT tell them the monster exists
http://arctic-news.blogspot.com/2013/10/just-do-not-tell-them-the-monster-exists.html

- Methane Release caused by Earthquakes
http://arctic-news.blogspot.com/2013/09/methane-release-caused-by-earthquakes.html

- Climate Plan
http://climateplan.blogspot.com


Jumat, 20 September 2013

A RUNAWAY GREENHOUSE EVENT

by John Davies

A linear trendline shows steady growth in the annual increase in CO2 levels, despite promises to reduce emissions.
Furthermore, recent increases show a worrying trend illustrated in the graph by a 4th order polynomial trendline. 

GROWTH RATE OF CARBON DIOXIDE IN THE ATMOSPHERE

The world is probably at the start of a runaway Greenhouse Event which will end most human life on Earth before 2040. This will occur because of a massive and rapid increase in the carbon dioxide concentration in the air which has just accelerated significantly. The increasing Greenhouse Gas concentration, the gases which cause Global Warming, will very soon cause a rapid warming of the global climate and a chaotic climate.

Immediately before the Industrial Revolution, in 1750, the concentration of carbon dioxide in the air which had been stable for millennia, the main Greenhouse gas, was 280 parts per million, but in 2013 it is likely to average 395 parts per million. It has been increasing at an increasing rate since 1750.

In 1960 the carbon dioxide concentration was 315 parts per million and in the 1960’s the concentration was increasing at 0.8 parts per million per year, in the 1980’s at 1.6 parts per million and from 2003 until 2011 inclusive it rose at 2 .0 parts per year.

In 2012 it rose 2.39 parts. Between July 2012 and July 2013 atmospheric carbon dioxide increased in concentration by 3.35 parts, by far the largest 12 month increase ever.


THIS HUGE INCREASE SHOULD BE PUBLISHED EVERYWHERE WORLDWIDE NOW

ASSESSMENT

When there have been large anomalous increases in the past, though nothing like this, there has been a rapid return to near normal but this is probably slightly different. The most likely growth in the calendar year 2013 is likely to be about 2.85 parts per million, a calendar year record , but much below the growth from July 2012 until July 2013. The growth for 2012 and 2013 is likely to average out at about 2.62 parts per million, a record for a two year period.

Again, looking to the past, when there has been a rise in concentration like we will have had in 2012 and 2013 the rate of increase in concentration diminishes for a couple of years before rising again. I would expect the rise in concentration in 2014 and 2015 to average 2.55 parts per million before rising at an increasing rate thereafter assuming the world carries on with business as usual. Nevertheless this average rate is faster than we have yet witnessed except for the 2012 and 2013 period. This rate of increase is much faster than that which preceded the greatest ever wipe out of life on earth 249 million years ago.

There is a significant uncertainty about the above growth rate in the near term, with a chance of a higher and lower growth rate though the above forecast is the most likely outcome.

There must be a small chance that this is really the start of a very fast runaway event. Should the growth rate of atmospheric carbon dioxide in 2013 be greater than about 3.1 parts per million then the world will probably have entered a very fast runaway event.

It is even more absolutely critical that carbon dioxide concentrations from August 2013 onwards are rising at a slower rate than between July 2012 and July 2013 otherwise the world will have entered a very fast runaway Greenhouse Event. Carbon Dioxide concentrations will almost certainly be rising at a slower rate from August 2013 onwards.

The runaway greenhouse event, or a very fast runaway Greenhouse Event is probably just starting, and can only be stopped by an immediate response. The danger is that it will very rapidly run out of our control. I think the net negative feedback to greenhouse gas emissions is just starting to diminish. It is not clear whether this is because the sinks are absorbing less carbon dioxide or a form of positive feedback is starting probably a bit of both.

The rising carbon dioxide levels will probably lead to rising global temperatures from about 2015 onwards which will cause more climatic disruption, especially severe droughts, and thus more carbon emissions almost certainly before 2020.

This is going to occur at a time when the Arctic Ocean will probably become free of sea ice leading to a different set of runaway events which will coalesce with the build-up of carbon dioxide in the atmosphere.

This will lead to societal collapse after rising global temperatures have caused severe droughts and a global famine at some time prior to 2040, but probably much sooner in about 2020 or in the 2020’s.

IMMEDIATE ACTION IS CRUCIAL

The absolute priority is that the world’s public and politicians are told about the rapidly increasing rate of carbon dioxide concentrations in the air which will cause a runaway Greenhouse Event, both in the media and in social media. The gravity of the situation needs to be accepted and all nations agree to co-operate to solve the problem.

There needs to be a world conference at which all nations agree the grave situation that the world is facing and that urgent and drastic action is essential. They need to accept and agree that all nations will cut greenhouse gas emissions to an accepted and equal low level of emissions per person. This will mean that only nations with very small emissions per person like the Central African Republic will not need to make any emission cuts. The rate of increase in Carbon Dioxide needs to be cut to 2 parts per million per annum by 2015 onwards. The arctic needs to be cooled so that the sea ice does not all melt before the end of the Arctic Summer.

Reducing the rate of carbon dioxide build-up in the atmosphere will be astoundingly difficult. Emissions must be cut drastically, but this will lead to a reduction of Sulphate aerosols in the atmosphere, which might cause temperatures to rise and more carbon to be emitted from biomass as droughts become more severe. The solution is to try the relatively easy route and then use geo-engineering as necessary. This involves huge societal changes, a more egalitarian society and a smaller global economy, but if it is not done almost everybody will die.

Secondly, a group of scientists needs to be formed under the authority of the United Nations to formulate geo-engineering technologies, to go together with cuts in emissions, to reduce the carbon dioxide content of the atmosphere, such as planting forests, and to cool the arctic to save the arctic sea ice.

The immediate priority is to accept the gravity of the situation and that all nations and peoples will co-operate to solve the problem.

These measures will give humanity a chance of saving civilization.


Selasa, 18 Juni 2013

Mean Methane Levels reach 1800 ppb

On May 9, the daily mean concentration of carbon dioxide in the atmosphere of Mauna Loa, Hawaii, surpassed 400 parts per million (ppm) for the first time since measurements began in 1958. This is 120 ppm higher than pre-industrial peak levels. This unfortunate milestone was widely reported in the media.

There's another milestone that looks even more threatening than the above one. On the morning of June 16, 2013, methane levels reached an average mean of 1800 parts per billion (ppb). This is more than 1100 ppb higher than levels reached in pre-industrial times (see graph further below).
NOAA image
Vostok ice core analysis shows that temperatures and levels of carbon dioxide and methane have all moved within narrow bands while remaining in sync with each other over the past 400,000 years. Carbon dioxide moved within a band with lower and upper boundaries of respectively 200 and 280 ppm. Methane moved within lower and upper boundaries of respectively 400 and 800 ppb.
Temperatures moved within lower and upper boundaries of respectively -8 and 2 degrees Celsius.

From a historic perspective, greenhouse gas levels have risen abruptly to unprecedented levels. While already at a historic peak, humans have caused emissions of additional greenhouse gases. There's no doubt that such greenhouse gas levels will lead to huge rises in temperatures. The question is how long it will take for temperatures to catch up and rise.


Below is another way of looking at the hockey stick. And of course, further emissions could be added as well, such as nitrous oxide and soot.


Large releases of methane must have taken place numerous times in history, as evidenced by numerous pockmarks, as large as 11 km (6.8 mi) wide.

Importantly, large methane releases in the past did not result in runaway global warming for a number of reasons:
  • methane release typically took place gradually over many years, each time allowing a large release of methane to be broken down naturally over the years before another one occurred. 
  • Where high levels of methane in the atmosphere persisted and caused a lot of heat to be trapped, this heat could still be coped with due to greater presence of ice acting as a buffer and consuming the heat before it could escalate into runaway temperature rises.
Wikipedia image
Veli Albert Kallio comments:

The problem with ice cores is that if there is too sudden methane surge, then the climate warms very rapidly. This then results the glacier surfaces melting away and the ice core begins to loose regressively surface data if there is too much methane in the air.

Because of this, there has been previous occurrences of high methane, and these were instrumental to bring the ice ages ice sheets to end (Euan Nisbet's Royal Society paper). The key to this is to look at some key anomalies and devise the right experiments to test the hypothesis for methane eruptions as the period to ice ages.

Thus, the current methane melting and 1800 ppm rise is nothing new except that there are no huge Pleistocene glaciers to cool the Arctic Ocean if methane goes to overdrive this time. In fact methane may have been many times higher than that but all surface ice kept melting away and staying regressive until cold water and ice from destabilised ice sheets stopped the supply of methane (it decays fast if supply is cut and temperatures fall back rapidly when seas rose).

The Laurentide Ice Sheet alone was equivalent of 25 Greenland Ice Sheets and the Weischelian and other sheets on top of that. So, the glaciers do not act the same way as fireman to extinguish methane. Runaway global warming is now possibility if the Arctic loses its methane holding capability due to warming.

Further discussion is invited on the following points:
  • The large carbon-12 emission anomalies in East Asian historical objects that are dateable by historical knowledge. Discussion about the explanations concocted and why methane emission from permafrost soils and sea beds must be the answer; 
  • the much overlooked fact that if there were ever very highly elevated concentrations of air in the Arctic, this would induce strong melting of glaciers which then lack those surface depositions where the air were most CH4 and CO2 laden. Even moderate levels of temperature rise damaged Larsen A, Larsen B, Petermann and Ellesmere glaciers. If huge runaway outgassing came out when Beringia flipped into soil warming, then methane came out really large amounts with CO2.
  • Discussion of the experiments how to compensate for the possible lack of "time" in methane elevated periods in the ice cores by alternative experiments to obtain daily, weekly, monthly and yearly emission rates of CH4 and CO2 from the Last Glacial Maximum to the Holocene Thermal Maximum (as daily, weekly, monthly, and yearly sampling of air).

Editor's update: Methane levels go up and down with the seasons, and differ by altitude. As above post shows, mean levels reached 1800 ppb in May 2013 at 586 mb, according to MetOp-2 data. Note that IPCC AR5 gives levels of 1798 ppb in 2010 and 1803 ppb in 2011, as further discussed in later posts such as this one. Also, see historic data as supplied by NOAA below.


Jumat, 10 Mei 2013

Climate change: Solutions to a big problem


Dorsi Diaz
By Dorsi Diaz

As the Arctic continues its full melt down for the first time in thousands of years, creative forward thinkers like inventor Patrick McNulty are exploring ways to restore the balance to our climate system which is on the verge of some monumental changes.


With abrupt climate change perhaps just a heartbeat away, McNulty has invented a tunnel idea that would hopefully help turn a glaring problem into a solution to the climate Armageddon that is bearing down on us. There's only one hitch though, Patrick's idea needs to have some further testing done, and that testing does not come cheap. What's needed is a University that's willing to take on Patrick's project and do some computer modeling with his tunnel idea.

McNulty, who has worked in the fossil fuel industry for over 20 years, has a background in solving problems as a production leader. His impressive bio gives us a clue as to why his tunnel idea needs a better look at it:

McNulty spoke with me and said, "I have worked in the fossil fuel power plant industry for 20 years at Florida Power And Light/ Nextera Energy as a production leader and control room operator and know why the burning of fossil fuels is so important to climate change and why we monitor Nitrous oxide, Sulfur Dioxide and CO2 exiting the stacks. The steam water cycle of the power plant is very similar to happens in our atmosphere and very similar to what hurricanes do to cool our climate."

Youtube video - If placed in the Gulfstream there are two phases of operation. Cooling and Non-Cooling phase. In cooling phase it upwells cooler water to the surface to regulate Sea Surface temps anywhere between 70 and 90 degrees to the nearest 1/10 of a degree while generating enormous amounts of hydroelectrical power from the Ke in the gulfstream current. In non-cooling phase just the warm water flows through it but it still generates the electrical power. They actually regulate climate.

In an interview yesterday with McNulty, he expressed what needs to happen with his invention to take it to the next step: Patrick says he needs, "A university that studies global climate, severe weather, drought and hurricanes that can computer model my idea. Once they input what my idea can do to sea surface temperatures in the Gulfstream, they can compute how they can change the climate to a more cooler one with very accurate solutions depending on what set point they input to the temperature controller of each tunnel."

McNulty goes on to explain how he got interested in coming up with a solution to the climate change challenge we now find ourselves in: "I started to think about how to weaken a hurricane first after Hurricane Hugo hit the Carolina's. Then Hurricane Andrew hit South Florida where I lived and I started to think more about it and communicated with the hurricane center in Miami about my idea. It was a simple idea and has evolved to what it is now after reading about Blaise Pascal and Daniel Bernoulli. Dr. Hugh Willoughby, the director of the Hurricane Research Center and now currently a professor at Florida International University (FIU), seemed somewhat impressed with my idea worked out a backdoor solution that said the idea can weaken a category 5 hurricane to a category 3 hurricane prior to landfall that would work on Hurricane Andrew type storms. The current director of the hurricane research center in Miami Fla. Dr. Frank Marks has also told me my idea should be computer modeled."

And this is why McNultys idea needs a closer look at it and a University to pick up and run with the ball. With the Arctic possibly being ice-free as soon as this summer, the window is fast closing to address the growing climate threat our changing climate presents - meaning even more extreme weather events on the near horizon.

And just how does inventor McNultys tunnel idea work? He gives us some clues here where he talks more about the logistics of the system: "It took me about 5 years between the time of Hurricane Hugo and Hurricane Andrew to come up with the idea. Since then and by accident I have found out how my idea can also restore our climate back to pre-industrial revolution temperatures by adding turbine generators to them. The kinetic energy in the Gulfstream is enormous and enough to displace fossil fuel power generation. I study the idea almost daily and have found the idea can reverse many of the ill effects of climate change that fossil fuels are bringing us today such as higher sea levels, higher sea surface temperatures, red tide, lower PH levels in our oceans, coral bleaching, loss of Northern summertime arctic ice, loss of albedo, skin cancer, lung cancer, war, heart attacks, stroke, asthma, loss of polar bears, sea lions, narwhals, walrus, kril, shrimp, rain forest's, soil moisture and more desertification etc. etc. etc."

With the threat of large pockets of methane gas being released in the Arctic and tipping us into runaway climate change, McNultys idea addresses this growing problem. He shared with me that: "The methane/CO2 issue in the Tundra and the methane ice is a big issue since it has 20 times the warming effect that CO2 has once released to the atmosphere. My idea keeps it frozen in place since it can restore the Arctic Ice to pre-industrial revolution extent/mass."

So with an idea brought forth to slow down our death march to Climate Armageddon, McNulty proposes an idea that could solve many of our problems. The only thing we need now is a bright team to take on the project and run some computer modeling on the tunnel idea.

With all the brilliant minds out there, who is interested in helping solve a world problem? And more importantly, be a part of saving the human race?

Patrick McNulty can be contacted through his Facebook page.

Kamis, 02 Mei 2013

No Planet B


By Andrew Glikson
Earth and paleo-climate science, Australian National University
IPCC Reviewer

The global CO2cide 400 ppm milestone

Figure 1. Mouna Loa Month ending May 1, 2013, from:  http://keelingcurve.ucsd.edu/


Figure 2. CO2 levels over the past 800,000,000 years, from:  http://keelingcurve.ucsd.edu/

Figure 3. Mouna Loa CO2 level 29 April, 2013 keelingcurve.ucsd.edu/ 
On the 29 April, 2013, NOAA recorded a CO2 level of 399.50 ppm, while some readings in April 2013 exceeded 400 ppm (Figures 1, 2 and 3, from: http://keelingcurve.ucsd.edu/), signifying a return to atmosphere conditions of the Pliocene (5.2 – 2.6 million years ago).

This followed a rise from 394.45 ppm to 397.34 ppm (March 2012 – 2013) at a rate of 2.89 ppm per year, unprecedented in the recorded geological history of the last 65 million years (Figure 4).

Pliocene temperatures - about 2 – 3 degrees C warmer than pre-industrial temperatures, resulted in an intense hydrological cycle, ensuing in extensive rain forests, lush savannas (now occupied by deserts), small ice caps and sea levels about 25 meters higher than at present (Figure 5).

Figure 4. CO2 rise rates vs Temperature rise rates for the Cainozoic (65 Ma to the present). 

Figure 5. The Pliocene Earth compared to the modern Earth 
http://www.giss.nasa.gov/research/features/199704_pliocene/page2.html
Note (1) the lower albedo in the Pliocene poles signifying the smaller
size of the ice caps and (2) the high albedo of 
the modern Sahara and
Gobi deserts signifying the a larger extent of Holocene deserts.
Life abounded during the Pliocene. However, regular river flow conditions such as allowed cultivation and along river valleys since about 7000 years ago, and temperate Mediterraneantype climates allowing extensive farming, could hardly exist under the intense hydrological cycle and heat wave conditions of the Pliocene.

Gradual to intermittent advents of Pleistocene ice ages over the last 2 million years allowed many species to adapt to changing conditions. Abrupt warming events, such as the DansgaardOeschger cycles, occurred during glacial periods (Figure 4). Extreme shifts in state of the climate exceed the rate to which many species can adapt.

The basic laws of atmospheric physics and chemistry and the behavior of past atmospheres indicate changes in the level of atmospheric greenhouse gases constitute a key parameter determining the current trend of the terrestrial climate. Concomitant rates of SO2 release, mainly from coal burning, have regulated changes in temperature.

Increases in SO2 release about 1950 and 2001 are responsible for slow-down of temperature rise (Figure 6).

Figure 6. Comparison of the rate of warming and variations in SO2 levels.
Temperature from 
GISS/NASA (http://data.giss.nasa.gov/gistemp/); SO2 levels after
http://www.atmos-chemphys.net/11/1101/2011/acp-11-1101-2011.html.
          Note the overlap between slow-down of overall 
temperature rise rates and increase in SO2 emissions
(http://www.atmos-chem-phys.net/11/1101/2011/acp-11-1101-2011.html) around 1950 and 2001. 
The current CO2 ppm/year rise rate of ~3 ppm/year surpasses any recorded since the last 65 million years of Earth history. High CO2 and temperature rises occurred about ~55 Ma ago. At that stage release of methane drove a CO2 rise of near-1800 ppm and a temperature rise of about 5 degrees C over 10,000 years, namely a rate of 0.18 ppm/year and 0.0005 degrees C/year (Zachos et al. 2008; http://www.nature.com/nature/journal/v451/n7176/full/nature06588.html).

The K-T asteroid impact of 65 Ma-ago resulted in a rise of more than 2000 ppm CO2 within about 10,000 years, namely ~0.2 ppm /year. This triggered a temperature rise of about 7.5 degrees C, namely 0.00075 degrees C per year (Beerling et al. 2002 http://www.pnas.org/content/99/12/7836.full) (Figure 4). Calculations by these authors suggest a release of approximately 4500 billion tons of carbon from impacted carbonates and shale, ignited bushfires and ocean warming.

The consequences of the current rise in greenhouse gases is manifested by enhancement of the hydrological cycle, with ensuing floods and of heat waves (http://www.ipcc-wg2.gov/SREX/ ; http://www.aph.gov.au/Parliamentary_Business/Committees/Senate_Committees?url=ec_ctte/extreme_weather/index.htm).

Open-ended combustion of known fossil fuel reserves (Figure 7) would lead to atmospheric CO2 levels of ~800 to 1000 ppm CO2, high degree to total melting of the polar ice caps, sea level rise on the scale of tens of meters and disruption of the biosphere on a scale analogous to recorded mass extinctions (http://www.astrobio.net/interview/2553/under-a-green-sky).

Figure 7. CO2 emissions by fossil fuels (1 ppm CO2 ~ 2.12 GtC). 
Alternative estimates of reserves and potentially recoverable resources are from EIA (2011) and GAC (2011).
We are 
headed toward 800 to 1,000+ ppm, which represents the near-certain destruction of modern civilization
as we know it -- as the recent scientific literature makes chillingly clear. 

(http://thinkprogress.org/climate/2012/01/28/413955/james-hansen-on-cowards/). 
Carbon emissions may be self-limiting. It is likely that, before atmospheric CO2 reach 500 ppm, disruption of fossil fuel-combusting systems by extreme weather events would result in reduction of emissions. On the other hand the extent to which amplifying feedback processes (methane release from permafrost and Arctic sediments, bushfires, warming oceans) would continue to add greenhouse gases to the atmosphere is uncertain.

Preoccupied with short-term economic forecast, daily A$ exchange rates, share market fluctuations and, sports results, with some exceptions (http://www.theage.com.au/national/greenhouse-gases-in-new-danger-zone-20130428-2imjm.html) the accelerating rate of atmospheric CO2 seems to hardly rate a mention on the pages of the global media.

There are few signs the extreme danger the terrestrial biosphere and the oceans are driving the global community to undertake the urgent large-scale measures required to attempt to arrest current trends.

In Australia the language has changed, from “the greatest moral issue of our generation” (http://www.youtube.com/watch?v=CqZvpRjGtGM) to hit-pocket controversy over a “carbon tax”, a meningless 5 percent reduction in local emissions which overlook the export of hundreds of million tons of coal, ending up in the same atmosphere.

There is no evidence the recent IPA celebration (http://www.crikey.com.au/2013/04/05/abbottbolt-rinehart-fawn-in-the-ipa-court-of-king-murdoch/), attended by the likely next prime minister, the world’s media moguls and mining magnates, as well as an archbishop, was concerned with the future of the Earth’s climate.

In professor Hans Joachim Schellnhuber’s words stated in Doha “overriding everything else the 1st Law of Humanity: Don’t kill your children!” (http://www.pik-potsdam.de/news/inshort/files/Schellnhuber-keynote-COP18-state-dinner-Doha.pdf).

There is no planet B.

Selasa, 16 April 2013

Another link between CO2 and mass extinctions of species

By Andrew Glikson, Australian National University
Andrew Glikson, earth and
paleo-climate scientist at
Australian National University

It’s long been known that massive increases in emission of CO2 from volcanoes, associated with the opening of the Atlantic Ocean in the end-Triassic Period, set off a shift in state of the climate which caused global mass extinction of species, eliminating about 34% of genera. The extinction created ecological niches which allowed the rise of dinosaurs during the Triassic, about 250-200 million years ago.

New research released in Science Express has refined the dating of this wave of volcanism. It shows marine and land species disappear from the fossil record within 20,000 to 30,000 years from the time evidence for the eruption of large magma flows appears, approximately 201 million years ago. These volcanic eruptions increased atmospheric CO2 and increased ocean acidity.

Mass extinctions caused by rapidly escalating levels of CO2 have occurred before. Global warming image from www.shutterstock.com
Mass extinctions due to rapidly escalating levels of CO2 are recorded since as long as 580 million years ago. As our anthropogenic global emissions of CO2 are rising, at a rate for which no precedence is known from the geological record with the exception of asteroid impacts, another wave of extinctions is unfolding.

Mass extinctions of species in the history of Earth include:
  • the ~580 million years-old (Ma) Acraman impact (South Australia) and Acrytarch (ancient palynomorphs) extinction and radiation 
  • Late Devonian (~374 Ma) volcanism, peak global temperatures and mass extinctions 
  • the end-Devonian impact cluster associated with mass extinction, which among others destroyed the Kimberley Fitzroy reefs (~360 Ma) 
  • the upper Permian (~267 Ma) extinction associated with a warming trend
  • the Permian-Triassic boundary volcanic and asteroid impact events (~ 251 Ma) and peak warming 
  • the End-Triassic (201 Ma) opening of the Atlantic Ocean, and massive volcanism 
  • an End-Jurassic (~145 Ma) impact cluster and opening of the Indian Ocean 
  • the Cretaceous-Tertiary boundary (K-T) (~65 Ma) impact cluster, Deccan volcanic activity and mass extinction 
  • the pre-Eocene-Oligocene boundary (~34 Ma) impact cluster and a cooling trend, followed by opening of the Drake Passage between Antarctica and South America, formation of the Antarctic ice sheet and minor extinction at ~34 Ma. 

Throughout the Phanerozoic (from 542 million years ago), major mass extinctions of species closely coincided with abrupt rises of atmospheric carbon dioxide and ocean acidity. These increases took place at rates to which many species could not adapt. These events – triggered by asteroid impacts, massive volcanic activity, eruption of methane, ocean anoxia and extreme rates of glaciation (see Figures 1 and 2) – have direct implications for the effects of the current rise of CO2.

Figure 1 – Trends in atmospheric CO2 and related glacial and interglacial periods since the Cambrian (542 million years ago), showing peaks in CO2 levels (green diamonds) associated with asteroid impacts and/or massive volcanism. CO2 data from Royer 2004 and 2006.
Figure 2 – Relations between CO2 rise rates and mean global temperature rise rates during warming periods, including the Paleocene-Eocene Thermal Maximum, early Oligocene, mid-Miocene, late Pliocene, Eemian (glacial termination), Dansgaard-Oeschger cycles, Medieval Warming Period, 1750-2012 and 1975-2012 periods.

In February 2013, CO2 levels had risen to near 396.80ppm at Mauna Loa Atmospheric Observatory, compared to 393.54ppm in February 2012. This rise – 3.26ppm per year – is at the highest rate yet recorded. Further measurements show CO2 is at near 400ppm of the atmosphere over the Arctic. At this rate the upper stability threshold of the Antarctic ice sheet, defined at about 500–600ppm CO2 would be reached later this century (although hysteresis of the ice sheets may slow down melting).

Our global carbon reserves – including coal, oil, oil shale, tar sands, gas and coal-seam gas – contain considerably more than 10,000 billion tonnes of carbon (see Figure 5). This amount of carbon, if released into the atmosphere, is capable of raising atmospheric CO2 levels to higher than 1000ppm. Such a rise in atmospheric radiative forcing will be similar to that of the Paleocene-Eocene boundary thermal maximum (PETM), which happened about 55 million years-ago (see Figures 1, 2 and 4). But the rate of rise surpasses those of this thermal maximum by about ten times.
Figure 3 – Plot of percent mass extinction of genera versus peak atmospheric CO2 levels at several stages of Earth history.
Figure 4 – The Paleocene-Eocene Thermal Maximum (PETM) represented by sediments in the Southern Ocean, central Pacific and South Atlantic oceans. The data indicate a) deposition of an organic matter-rich layer consequent on extinction of marine organisms; b) lowering of δ18O values representing an increase in temperature and c) a sharp decline in carbonate contents of sediments representing a decrease in pH and increase in acidity (Zachos et al 2008) 

The Paleocene-Eocene boundary thermal maximum event about 55 million years ago saw the release of approximately 2000 to 3000 billion tons of carbon to the atmosphere in the form of methane (CH4). It led to the extinction of about 35-50% of benthic foraminifera (see Figure 3 and 4), representing a major decline in the state of the marine ecosystem. The temperature rise and ocean acidity during this event are shown in Figures 4 and 6.

Based on the amount of carbon already emitted and which could continue to be released to the atmosphere (see Figure 5), current climate trends could be tracking toward conditions like those of the Paleocene-Eocene event. Many species may be unable to adapt to the extreme rate of current rise in greenhouse gases and temperatures. The rapid opening of the Arctic Sea ice, melting of Greenland and west Antarctic ice sheets, and rising spate of floods, heat waves, fires and other extreme weather events may signify a shift in state of the climate, crossing tipping points.
Figure 5 – CO2 emissions from fossil fuels (2.12 GtC ~ 1 ppm CO2). Estimated reserves and potentially recoverable resources.By analogy to medical science analysing blood count as diagnosis for cancer, climate science uses the greenhouse gas levels of the atmosphere, pH levels of the ocean, variations in solar insolation, aerosol concentrations, clouding states at different levels of the atmosphere, state of the continental ice sheets and sea ice, position of high pressure ridges and climate zones and many other parameters to determine trends in the climate. The results of these tests, conducted by thousands of peer-reviewed scientists world-wide, have to date been ignored, at the greatest peril to humanity and nature.

Continuing emissions contravene international laws regarding crimes against humanity and related International and Australian covenants. In the absence of an effective global mitigation effort, governments world-wide are now presiding over the demise of future generations and of nature, tracking toward one of the greatest mass extinction events nature has seen. It is time we learned from the history of planet Earth.

Figure 6: The Paleocene-Eocene boundary thermal maximum. http://www.uta.edu/faculty/awinguth/petm_research/petm_home.html

This article was earlier published at The Conversation (on March 22, 2013).