Tampilkan postingan dengan label global. Tampilkan semua postingan

Jumat, 04 Juli 2014

Climate Plan

This image sums up the lines of action, to be implemented in parallel and as soon as possible, and targets of the Climate Plan, in order to avoid climate catastrophe.

The Climate Plan and its various parts have been discussed in many post at Arctic-news blog over the years.

Now is the time to support the Climate Plan and to make sure that it will be considered at many forums, such as the Climate Summit, to be held September 23, 2014, at the U.N. Headquarters in New York, and preparations for the UNFCCC Climate Change Conference in Paris in 2015.

Please show your support by sharing this text and the image widely!


Emission cuts

In nations with both federal and state governments such as the U.S., the President (or Head of State or Cabinet, basically where executive powers are held) can direct:
  • federal departments and agencies to reduce their emissions for each type of pollutant annually by a set percentage, say, CO2 and CH4 by 10%, and HFCs, N2O and soot by higher percentages.
  • the federal Environmental Protection Agency (EPA) to make states each achieve those same reductions. 
  • Target: 80% cut everywhere for each type of pollutant
    by 2020 (to be managed locally provided targets are met)
  • the EPA to monitor progress by states and to step in with more effective action in case a state looks set to miss one or more targets.
    (More effective action in such a case would be to impose (federal) fees on applicable polluting products sold in the respective state, with revenues used for federal benefits. Such federal benefits could include building interstate High-Speed Rail tracks, adaptation and conservation measures, management of national parks, R&D into batteries, ways to vegetate deserts and other land use measurements, all at the discretion of the EPA. Fees can be roughly calculated as the average of fees that other states impose in successful efforts to meet their targets.)
Similar policies could be adopted elsewhere in the world, and each nation could similarly delegate responsibilities to states, provinces and further down to local communities.

Carbon dioxide removal and storage
Target: restore atmosphere and ocean to long term average
by 2100 (with each nation's annual contributions to reflect
its past emissions)

Energy feebates can best clean up energy, while other feebates (such as pictured in the above diagram) can best raise revenue for carbon dioxide removal. Energy feebates can phase themselves out, completing the necessary shift to clean energy within a decade. Carbon dioxide removal will need to continue for much longer, so funding will need to be raised from other sources, such as sales of livestock products, nitrogen fertilizers and Portland cement.

A range of methods to remove carbon dioxide would be eligible for funding under such feebates. To be eligible for rebates, methods merely need to be safe and remove carbon dioxide.

There are methods to remove carbon dioxide from the atmosphere and/or from the oceans. Rebates favor methods that also have commercial viability. In case of enhanced weathering, this will favor production of building materials, road pavement, etc. Such methods could include water desalination and pumping of water into deserts, in efforts to achieve more vegetation growth. Selling a forest where once was a desert could similarly attract rebates.

Some methods will be immediately viable, such as afforestation and biochar. It may take some time for methods such as enhanced weathering to become economically viable, but when they do, they can take over where afforestation has exhausted its potential to get carbon dioxide back to 280ppm.

Additionally, conservation and land use measures could help increase carbon storage in ecosystems.

Solar radiation management

Target: prevent Arctic Ocean from warming by more
than 1°C above long term average (U.N. supervised)
Apart from action to move to a more sustainable economy, additional lines of action are necessary to reduce the danger of runaway global warming.

Extra fees on international commercial aviation could provide funding for ways to avoid that the temperature of the atmosphere or the oceans will rise by more than 1°C above long term average.

Due to their potential impact across borders, these additional lines of action will need ongoing research, international agreement and cooperation.

Land, clouds, wind, water, snow and ice management

Target: increase Arctic snow and ice cover (U.N.
supervised) and restore it to its long term average 
Apart from action to move to a more sustainable economy, additional lines of action are necessary to reduce the danger of runaway global warming.

Extra fees on international commercial aviation could also provide funding for ways to cool the Arctic and restore the snow and ice cover to its long term average extent.

As said, due to their potential impact across borders, these additional lines of action will need ongoing research, international agreement and cooperation.

Methane management and further action

Target: relocate vulnerable Arctic clathrates (U.N. supervised)
and restore mean atmospheric CH4 level to long term average
by 2100 (with each nation's annual contributions to reflect its
past emissions.
Further action is needed to avoid that huge quantities of methane will abruptly erupt from the seafloor of the Arctic Ocean.

Vulnerable hydrates should be considered to be relocated under U.N. supervision.

Besides this, local action can be taken to reduce methane levels in the atmosphere with each nation's annual contributions to reflect its past emissions.

Adaptation, conservation and land use measures could further improve the situation.

The comprehensive and effective action of the Climate Plan will reduce the threat of runaway warming, and this will have obvious benefits for the environment and for species threatened with extiction.

Besides this, this will also save people money, will improve people's health and safety, will increase security of food and fresh water supply, will make energy supply and the electric grid more efficient, safe, robust and reliable, will reduce perceived needs for military forces to police fuel supply lines globally, and will create numerous local job and investment opportunities.


Please support, follow and discuss the Climate Plan at facebook.com/ClimatePlan and at ClimatePlan.blogspot.com


Senin, 16 Juni 2014

Warming of the Arctic Fueling Extreme Weather

Extreme weather

Heavy rains and floods hit Serbia and Bosnia in May 2014, as discussed in an earlier post.

Later in May, further flooding hit central Europe. From May 30 to June 1, 2014, parts of Austria received the amount of rain that normally falls in two-and-half months: 150 to 200 mm (5.9 to 7.9"), with some parts experiencing 250 mm (9.8").

What is fueling this extreme weather? Have a look at the image below.


The image shows a number of feedbacks that are accelerating warming in the Arctic. Feedback #14 refers to (latent) heat that previously went into melting. With the demise of the snow and ice cover, an increasing proportion of this heat gets absorbed and contributes to accelerated warming in the Arctic.

As the sea ice heats up, 2.06 J/g of heat goes into every degree Celsius that the temperature of the ice rises. While the ice is melting, all energy (at 334J/g) goes into changing ice into water and the temperature remains at 0°C (273.15K, 32°F). 

Once all ice has turned into water, all subsequent heat goes into heating up the water, at 4.18 J/g for every degree Celsius that the temperature of water rises.

The amount of energy absorbed by melting ice is as much as it takes to heat an equivalent mass of water from zero to 80°C. The energy required to melt a volume of ice can raise the temperature of the same volume of rock by 150ยบ C.

Currently, the energy equivalent of 1.5 million Hiroshima bombs goes into melting of the Arctic sea ice each year, according to calculations by Sam Carana.

As the ice disappears, this energy will instead be absorbed elsewhere and cause temperatures in the Arctic to rise further, indicated as feedback #14.

This comes on top of the albedo feedback #1 that can on its own more than double the net radiative forcing resulting from the emissions caused by all people of the world, according to calculations by Prof. Peter Wadhams.

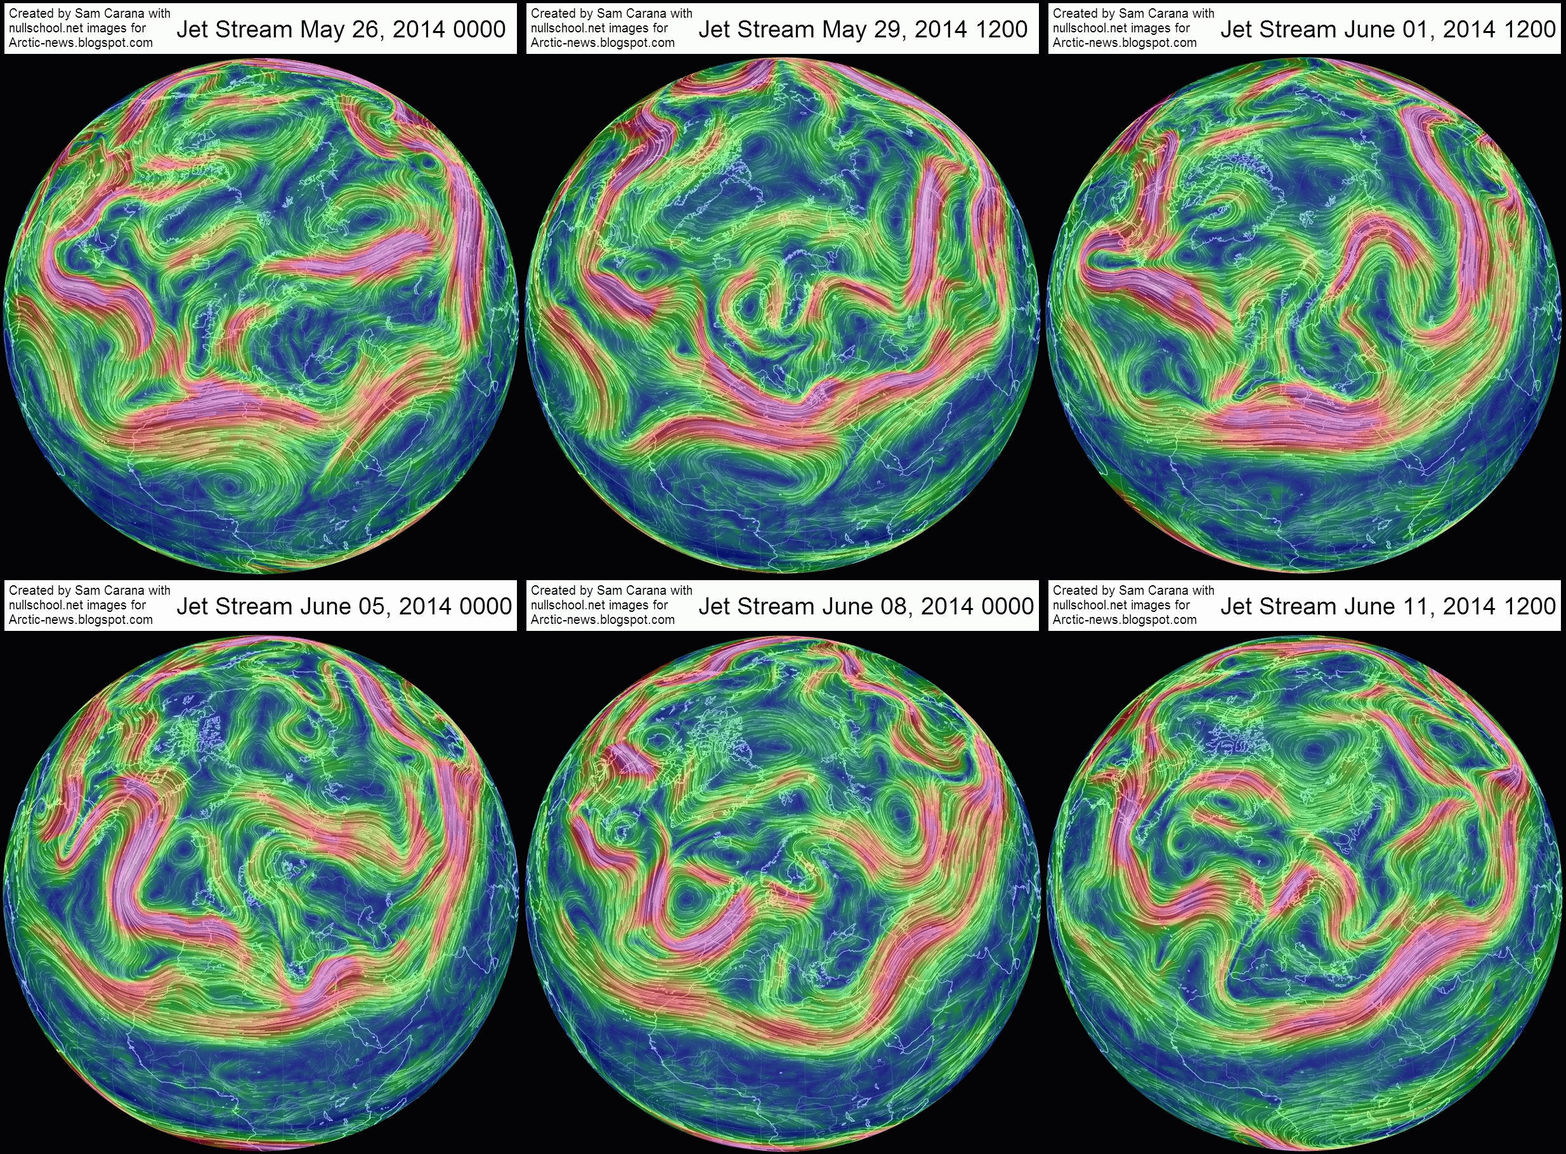
Further feedbacks include changes to the polar vortex and jet stream that are in turn causing more extreme weather, as also described in the earlier post Feedbacks in the Arctic.


Global Warming

Higher levels of greenhouse gases are trapping more heat in the atmosphere, resulting in more intense heatwaves in some places, while stronger winds and greater evaporation of water from the sea lead to stronger rainfall in other places. Global warming thus contributes to more extreme weather around the globe.

The Arctic is hit not only by the warming resulting from greenhouse gas emissions, but also by emissions of soot, dust and other compounds that settle on the snow and ice cover and speed up its demise.

As illustrated by the image below, by Nuccitelli et al., most heat goes into the oceans. A substantial amount of heat also goes into the melting of ice.

A lot of ocean heat is transported by the Gulf Stream into the Arctic Ocean. The North Atlantic is hit particularly strongly by pollution from North America, as illustrated by the image below.

[ screenshot from Perdue University's Vulcan animation ]
Heat carried by the Gulf Stream into the Arctic Ocean contributes to high sea surface anomalies in the Arctic, as illustrated by the image below. Arctic sea ice is under threat from heat from the North Atlantic, while heat from the Pacific Ocean that was in part caused by pollution from east-Asia is now threatening to enter the Arctic Ocean through the Bering Strait, as illustrated by the image below that shows areas with sea surface temperature anomalies well over 8 degrees Celsius. 

[ click on image to enlarge ]
Warmer water in the Arctic Ocean in turn causes methane to be released from the seafloor of the Arctic Ocean, as discussed further below. 


Accelerated Warming in the Arctic

As said, warming hits the Arctic particularly strongly due to feedbacks such as albedo changes caused by the demise of the snow and ice cover in the Arctic. Another feedback is a changing jet stream. The jet stream used to circumnavigate the globe at high speed, separating climate systems that used to be vastly different above and below the jet stream. Accelerated warming in the Arctic is decreasing the temperature difference between the Arctic and the Equator, in turn causing the jet stream to slow down and become wavier. As a result, air can more easily move north to south and visa versa, especially when the jet stream's waves expand vertically and take a long time to move from west to east (i.e. a blocking pattern).

These changes to the jet stream are fueling extreme weather events. In the May/June event, a large loop had developed in the jet stream over Europe and got stuck in place, making a strong southerly wind carry moisture-laden air from the Mediterranean Sea over Central Europe, clashing with colder air flowing down from the north as the jet stream was stuck in such a blocking pattern.

Record May heat hit northern Finland and surrounding regions of Russia and Sweden. Earlier in May (on May 19) an all-time national heat record was set of 91.4°F (33.0°C) in St. Petersburg, Russia, slashing the previous record by a wide margin. This temperature was unprecedented in records in St. Petersburg that started in 1881 and show a previous May record set in 1958 of 87.6°F (30.9°C).

The compilation below shows the jet stream on three days (May 24, 25 and 27), on top of surface temperature anomalies for those days.

[ click on image to enlarge ]

Further illustrating the event is the animation below, showing the jet stream from May 26 to June 11, 2014. Note that this is a 14.5 MB file that may take some time to fully load.

[ click on image to enlarge ]
Methane

Huge methane emissions took place from the seafloor of the Arctic Ocean from September 2013 to March 2014. These emissions have meanwhile risen up higher in the atmosphere and have moved closer to the equator.


Compared to June 2013, mean methane levels at higher altitudes are now well over 10 ppb higher at higher altitudes while there has been only little change closer to the ground. Since these mean levels are global means, the difference is even more pronounced at specific locations on the Northern hemisphere, where clouds of methane originating from the Arctic are contributing to the occurence of heat waves.

The contribution of methane to such heatwaves depends on the density of the methane at the time in the atmosphere over the location during such events.

Highest global mean methane levels varied from 1907 ppb to 1812 ppb for the period June 6 to 15, 2014, as illustrated by the image on the right, and peak methane concentration varied a lot from day to day. On June 6, 2014, peak readings as high as 2516 ppb were recorded.

Indicative for what can be the result is the temperature anomaly on May 19, when temperatures went up as high as 91.4°F (33.0°C) in St. Petersburg, Russia, slashing the previous record by a wide margin, of more than 2°C, as described above


Conclusion

The situation is the Arctic is threatening to escalate into runaway warming and urgently requires comprehensive and effective action as discussed at the Climate Plan blog.


References

- May 2014 Global Weather Extremes Summary

- Extreme Jet Stream Pattern Triggers Historic European Floods
http://www.wunderground.com/blog/JeffMasters/extreme-jet-stream-pattern-triggers-historic-european-floods


Related posts

- The Biggest Story of 2013
http://arctic-news.blogspot.com/2013/12/the-biggest-story-of-2013.html

- Climate Plan
http://climateplan.blogspot.com
- More extreme weather can be expected
http://arctic-news.blogspot.com/2014/05/more-extreme-weather-can-be-expected.html

- Extreme weather strikes around the globe - update
http://arctic-news.blogspot.com/2014/02/extreme-weather-strikes-around-the-globe-update.html

- Escalating extreme weather events to hammer humanity (by Paul Beckwith)
http://arctic-news.blogspot.com/2014/04/escalating-extreme-weather-events-to-hammer-humanity.html

- Our New Climate and Weather (by Paul Beckwith)
http://arctic-news.blogspot.com/2014/01/our-new-climate-and-weather.html

- Our New Climate and Weather - part 2 (by Paul Beckwith)
http://arctic-news.blogspot.com/2014/01/our-new-climate-and-weather-part-2.html

- Changes to Polar Vortex affect mile-deep ocean circulation patterns
http://arctic-news.blogspot.com/2012/09/changes-to-polar-vortex-affect-mile-deep-ocean-circulation-patterns.html

- Polar jet stream appears hugely deformed
http://arctic-news.blogspot.com/2012/12/polar-jet-stream-appears-hugely-deformed.html


Rabu, 16 April 2014

Near-Term Human Extinction

Global Warming and Feedbacks

Is there a mechanism that could make humanity go extinct in the not-too-distant future, i.e. within a handful of decades?

Most people will be aware that emissions due to human activity are causing global warming, as illustrated by the arrow marked 1 in the image on the left. Global warming can cause changes to the land, to vegetation and to the weather. This can result in wildfires that can in turn cause emissions, thus closing the loop and forming a self-reinforcing cycle that progressively makes things worse.

Furthermore, less forests and soil carbon also constitute a decrease in carbon sinks, resulting in carbon that would otherwise have been absorbed by such sinks to instead remain in the atmosphere, thus causing more global warming, as illustrated by the additional downward arrow in the image on the right. In conclusion, there are a number of processes at work that can all reinforce the impact of global warming.

Emissions can also contribute more directly to land degradation, to changes in vegetation and to more extreme weather, as indicated by the additional arrow pointing upward in the image on the right. A recent study by Yuan Wang et al. found that aerosols formed by human activities from fast-growing Asian economies can cause more extreme weather, making storms along the Pacific storm track deeper, stronger, and more intense, while increasing precipitation and poleward heat transport.

Accelerated Warming in the Arctic

Similar developments appear to be taking place over the North Atlantic. Huge pollution clouds from North America are moving over the North Atlantic as the Earth spins. In addition, the Gulf Stream carries ever warmer water into the Arctic Ocean. As the image below shows, sea surface temperature anomalies at the highest end of the scale (8 degrees Celsius) are visible off the coast of North America, streching out all the way into the Arctic Ocean.


As said, feedbacks as are making the situation progressively worse. Feedback loops are causing warming in the Arctic to accelerate. Warming in the Arctic is accelerating with the demise of the snow and ice cover in the Arctic, and this is only feedback #1 out out many feedbacks that are hitting the Arctic, as described in an earlier post. As the temperature difference between the equator and the Arctic decreases, the Jet Stream is changing, making it easier for cold air to move out of the Arctic and for warm air from lower latitudes to move in (feedback #10).


Abrupt Climate Change leading to Extinction at Massive Scale

The danger is that, as temperatures over the Arctic Ocean warm up further and as the Gulf Stream carries ever warmer water into the Arctic Ocean, large quantitities of methane will erupt abruptly from the seafloor of the Arctic Ocean, adding a third kind of warming, runaway warming resulting in abrupt climate change, and leading to mass death, destruction and extiction of species including humans.

Persistence of such a progression makes it inevitable that the rest of Earth will follow the huge temperature rises in the Arctic. Massive wildfires will first ignite across higher latitudes, adding further greenhouse gas emissions and causing large deposits of soot on the remaining snow and ice on Earth, with a huge veil of methane eventually spreading around the globe. The poster below, from an earlier post, illustrates the danger.

[ click on image to enlarge - note that this is a 1.8 MB file that may take some time to fully load ]
Views by Contributors

How likely is it that the above mechanism will cause human extinction within the next few decades? What views do the various contributors to the Arctic-news blog have on this?

Guy McPherson has long argued that, given the strengths of the combined feedbacks and given the lack of political will to take action, near-term human extinction is virtually inevitable.

In the video below, Paul Beckwith responds to the question: Can climate change cause human extinction?


Further contributors are invited to have their views added to this post as well. While many contributors may largely share Paul Beckwith's comments, it's important to highlight that contributors each have their own views, and this extends to their preference for a specific plan of action.

Geo-engineering

One of the more controversial issues is the use of geo-engineering. Guy McPherson doesn't believe geo-engineering will be successful. In the video below, Paul Beckwith gives his (more positive) views on this.


I must admit that the lack of political will to act is rather depressing, especially given the huge challenges ahead. So, I can understand that this can make some of us pessimistic at times. Nonetheless, I am an optimist at heart and I am convinced that we can get it right by giving more support to a Climate Plan that is both comprehensive and effective, as discussed at ClimatePlan.blogspot.com


Rabu, 19 Februari 2014

High methane levels over the Arctic Ocean on February 17, 2014


Above image shows IASI methane readings over the last day or so, when levels as high as 2223 ppb were recorded.

Where does the methane come from?

On above image, methane shows up prominently along the faultline that crosses the Arctic Ocean from the northern tip of Greenland to the Laptev Sea. This indicates that the methane originated from the depths of the Arctic Ocean, where sediments contain large amounts of methane in the form of free gas and hydrates, which have become destabilized.

High methane concentrations have persistently shown up over the Arctic Ocean since October 1, 2013. On January 19, 2014, levels as high as 2363 ppb were recorded over the Arctic Ocean, as illustrated by the image below, from an earlier post.

[ from earlier post, click on image to enlarge ]
Below is a comparison of methane readings for the week from February 9 to 16, 2014, compared to the same period in 2013.

[ from earlier post, click on image to enlarge ]
The above comparison shows that there is a lot of methane over the Arctic Ocean that wasn't there last year. 

Furthermore, high methane readings show up where currents move the sea ice out of the Arctic Ocean, in areas such as Baffin Bay. This indicates that methane that is released from the seafloor of the Arctic Ocean appears to be moving underneath the ice along with exit currents and entering the atmosphere where the sea ice is fractured or thin enough to allow the methane to pass through. 

Also note that more orange areas show up on the southern hemisphere in 2014, indicating that more methane from the northern hemisphere is now spreading south beyond the equator. This in addition to indications that more methane is rising and building up at higher altitudes, as discussed in an earlier post.

Causes

What made these high releases from the seafloor of the Arctic Ocean persist for so long? At this time of year, one might have thought that the water in the Arctic Ocean would be much colder than it was, say, on October 1, 2013.

Actually, as the combination image below shows, sea surface temperatures have not fallen much at the center of the Arctic Ocean between early October, 2013 (left) and February 17, 2014 (right). In the area where these high methane concentrations occured, sea surface temperatures have remained the same, at about zero degrees Celsius.

[ click on image to enlarge ]
The above comparison image shows that, while surface temperatures in the Atlantic Ocean may have fallen strongly with the change of seasons, surface temperatures in the Arctic Ocean have changed only little.

In this case of course, what matters more than surface temperatures are water temperatures at greater depth. Yet, even here temperatures in the Arctic Ocean will have decreased only slightly (if at all) compared to early October 2013, since the Gulf Stream has continued to push warmer water into the Arctic, i.e. water warmer than the water in the Arctic Ocean, so the heating impact of the Gulf Stream continues. Also, sea surface temperature anomalies along the path of the Gulf Stream continue to be anomalously high, as the image below shows.


The situation looks even more grim on the Climate Reanalyzer image below, showing sea surface temperature anomalies that are far more profound in the Arctic Ocean.


Note also that, as the sea ice extent increased, there have been less opportunities for the heat to evaporate on the surface and for heat to be transferred from the Arctic Ocean to the air.

Finally, what matters a lot is salinity. The combination image below compares salinity levels between October 1, 2013 (left), and February 17, 2014 (right).

[ click on image to enlarge ]
Salinity levels were low on October 1, 2013, as a lot of ice and snow had melted in the northern summer and rivers had carried a lot of fresh water into the Arctic Ocean. After October 1, 2013, little or no melting took place, yet the Gulf Stream continued to carry waters with higher salt levels from the Atlantic Ocean into the Arctic Ocean.

Annual mean sea surface salinity
Seawater typically has a salinity level of over 3%; it freezes and melts at about −2°C (28°F). Where more saline water from the Atlantic Ocean flows into the Arctic Ocean, the water in the Arctic Ocean becomes more saline. The freezing and melting point of fresh water (i.e. zero salinity) is 0°C (or 32°F). More salinity makes frozen water more prone to melting, i.e. at temperatures lower than 0°C, or as low as −2°C.

As the salinity levels of the water on the seafloor of the Arctic Ocean increased, the ice that had until then held the methane captive in hydrates on the seafloor of the Arctic Ocean started to melt. Indeed, the areas in the Arctic Ocean where the high methane releases occurred on January 14, 2014 (top image) show several practical salinity units (psu) increase since October 1, 2013.

Higher salinity levels are showing up closer to the faultline that runs through the Arctic Ocean from the top of Greenland to the Laptev Sea.


Quantities

These high levels of methane showing up over the Arctic Ocean constitute only part of the methane that did escape from the seafloor of the Arctic Ocean. Where these high concentrations did show up, the ocean can be thousands of meters deep, giving microbes plenty of opportunity to decompose methane rising through the water first. Furthermore, the methane has to pass through sea ice that is now getting more than one meter thick in the area where these high levels of methane showed up on satellite records. In conclusion, the quantities of methane that were actually released from the seafloor must have been huge.

Importantly, these are not one-off releases, such as could be the case when hydrates get destabilized by an earthquake. As the Arctic-news blog has documented, high releases from the seafloor of the Arctic Ocean have been showing up persistently since early October 2013, i.e. 4½ months ago. This blog has warned about the threat for years. This blog has also described in detail the mechanisms that are causing these releases and the unfolding climate catastrophe that looks set to become more devastating every year. The poster below illustrates the danger.

[ click on image to enlarge - note that this is a 4.9 MB file that may take some time to fully load ]
Impacts and Response

Huge releases from the seafloor of the Arctic Ocean have occurred persistently since early October 2013, even when releases like this may show up for one day in one area without showing up in that same area the next day on satellite images.

This apparent 'disappearance' can be due to the Coriolis effect that appears to move the methane, whereas it is in fact the Earth that is spinning underneath the methane. This doesn't mean that the methane had disappeared. Actually, much of this methane will persist over the Arctic for many years to come and will continue to exercize its very high initial warming potential over the Arctic for years.

Furthermore, even if less methane may show up on satellite images the next day, that doesn't necessarily mean that releases from the seafloor has stopped. Instead, it looks like methane is being released continuously from destabilizing hydrates. The methane may accumulate underneath the sea ice for some time, to burst through at a moment when fractures or ruptures occur in the sea ice, due to changes in wind and wave height.

Methane released from the Arctic Ocean seafloor has contributed to high surface temperature anomalies over the Arctic Ocean in a number of ways. As a potent greenhouse gas, methane is trapping heat that would otherwise radiate into space. Furthermore, methane rising through the sea ice reduces growth of the sea ice.


The danger is that methane will further warm up the air over the Arctic, causing further weakening of the Jet Stream and further extreme weather events, particularly extreme warming of water all the way along the path of the Gulf Stream from the Atlantic Ocean into the Arctic Ocean, in turn triggering further releases from hydrates at the seafloor of the Arctic Ocean and escalating into runaway global warming. This threat calls for comprehensive and effective action, such as described at the ClimatePlan blog.


Sabtu, 08 Februari 2014

CO2 growth highest on record

Despite many promises, global emissions of carbon dioxide (CO2) continue to grow.

NOAA figures show that 2013 CO2 level growth was the highest ever recorded, i.e. 2.95 ppm.

The EPA expects U.S. 2013 energy-related CO2 emissions to be 2% higher than in 2012.

The UC San Diego image below shows CO2 levels in the atmosphere over the past two years.

Back in September 2013, John Davies warned: The world is probably at the start of a Runaway Greenhouse Event which will end most human life on Earth before 2040. This will occur because of a massive and rapid increase in the carbon dioxide concentration in the air which has just accelerated significantly. The increasing Greenhouse Gas concentration, the gases which cause Global Warming, will very soon cause a rapid warming of the global climate and a chaotic climate.

The post featured a graph with a 4th-order polynomial trendline pointing at some 7.5 ppm CO2 annual growth by 2040. While many welcomed the warning contained in the graph, some argued against using higher-order polynomial trendlines. So, for those who don't feel comfortable with a 4th-order polynomial trendline, the graph below adds both a linear trendline and a 3rd-order polynomial trendline.


The 3rd-order polynomial trendline, based on the recent data, points at CO2 annual growth of some 7 ppm by 2040, justifying the warning sounded by the 2013 graph.

And what do the recent data say, when a 4th-order polynomial trendline is applied? As the image below shows, they show an even steeper rise, reaching 7 ppm growth per year as early as 2030.


As many posts at this blog have warned, rapid growth in greenhouse gases and numerous feedbacks are threatening to push Earth into runaway global warming. This calls for comprehensive and effective action to - among other things - reduce atmospheric CO2 levels back to 280 ppm, as illustrated by the image below and as further discussed at the Climate Plan blog.


Sabtu, 01 Februari 2014

Abrupt Climate Change - by Paul Beckwith

by Paul Beckwith

Humans have benefited greatly from a stable climate for the last 11,000 years - roughly 400 generations. Not anymore. We now face an angry climate. One that we have poked in the eye with our fossil fuel stick and awakened. Now we must deal with the consequences. We must set aside our differences and prepare for what we can no longer avoid. And that is massive disruption to our civilizations.

In a nutshell, the logical chain of events occurring is as follows:
  1. Greenhouse gases that humans are putting into the atmosphere from burning fossil fuels are trapping extra heat in the earth system (distributed between the oceans (93%), the cryosphere (glaciers, ice sheets, sea ice for 3%), the earth surface (rocks, vegetation, etc. for 3%) and the atmosphere (only an amazingly low 1%). The oceans clearly get the lions share of the energy, and if that 1% heating the atmosphere varies there can be decades of higher or lower warming, as we have seen recently. This water vapor rises and cools condensing into clouds and releasing its stored latent heat which is increasing storm intensity.
  2. (i)Rapidly declining Arctic sea ice (losing about 12% of volume per decade) and (ii)snow cover (losing about 22% of coverage in June per decade) and (iii)darkening of Greenland all cause more solar absorption on the surface and thus amplified Arctic warming (global temperatures have increased (on average) about 0.17oC per decade, the Arctic has increased > 1oC per decade, or about 6x faster)
  3. Equator-to-Arctic temperature difference is thus decreasing rapidly
  4. Less heat transfer occurs from equator to pole (via atmosphere, and thus jet streams become streakier and wavier and slower in west-to-east direction, and via ocean currents (like Gulf Stream, which slows and overruns continental shelf on Eastern seaboard of U.S.)
  5. Storms (guided by jet streams) are slower and sticking and with more water content are dumping huge torrential rain quantities on cities and widespread regions at higher latitudes than is “normal”.
  6. A relatively rare meteorological event called an “atmospheric river” is now much more common, and injects huge quantities of water over several days to specific regions, such as Banff (with water running downhill to Calgary) and Toronto and Colorado events.
The above is extracted from one of Paul's earlier posts.

Paul discusses more details in the videos below. Our abruptly changing climate system: where we are and where we are going.

Abrupt Climate Change - part 1


And the next part, Abrupt Climate Change - part 2


Extreme weather is like a sledgehammer repeatedly pounding away at the inaction, lethargy, and climate change denial that is prevalent in rich Western countries around the world.

Inevitably, the hammer pounding will increase in frequency, severity, duration, and spatial extent over the next few years until the denial crumbles, in spite of the annual one billion dollars in fossil fuel money that is paid to support fraud by hiding the truth on the threat that we all face. 

A tipping point in collective societal behaviour will occur, and humanity will finally initiate action, albeit frantically, to begin to deal with the largest problem ever faced in our history.


Paul Beckwith is a part-time professor with the laboratory for paleoclimatology and climatology, department of geography, University of Ottawa. He teaches second year climatology/meteorology. His PhD research topic is “Abrupt climate change in the past and present.” He holds an M.Sc. in laser physics and a B.Eng. in engineering physics and reached the rank of chess master in a previous life.

Senin, 27 Januari 2014

Our New Climate and Weather - part 2


by Paul Beckwith

continued from part 1

In North America we are about to experience a late January, 2014 weather event that will likely go down in the record books, at least for a few weeks until the next event. Such is life on our rapidly changing planet in Climate 2.0, or perhaps this would better be called the great abrupt climate change transition between Climate 1.0 (our old climate) and the new, much warmer Climate 2.0.

In any event, the jet stream is configuring into that two crest/two trough mode that I discussed above. An enormous plug of cold Arctic air is descending southward across North America with temperature anomalies 20 degrees C below normal (36 degrees F below normal). It likely reaches far enough south to enter into northern Mexico and to cover large parts of Florida and extend out into the Gulf of Mexico and the Atlantic, resulting in northern Florida dropping below freezing (see my YouTube video below).

For more commentary on above video, see the post Deep Freeze and Abrupt Climate Change

Meanwhile, in turn, almost the entire Arctic region is seeing huge positive temperature anomalies that are 20 degrees C above normal (36 degrees F above normal). This air is changing the Arctic circulation patterns, and although the Arctic air temperature is still below zero, it is so much warmer than normal that the thickening and area growth of sea ice is being severely curtailed. There is strong ice motion out of the Fram Strait between Greenland and Svalbard which is carrying some of the thickest ridged ice just north of the Canadian archipelago out to warmer water and destruction. In the Bering Strait the ice motion is switching between transport of warm Pacific Ocean water into the Arctic Ocean and export of cold Arctic Ocean water out into the Pacific, leading to less ice formation outside the strait.


The easternmost and westernmost edges of North America are outside the jet stream trough, and being in the ridge on either side of the trough are experiencing record warm temperatures. Snow is minimal there, and lakes that would normally have frozen long ago are open water. Further south on the west coast, California is undergoing a record drought and the Sierra Nevada snow pack which feeds the rivers and reservoirs in the state is only at 15 to 20% of normal levels. And this is the normal rainy season for California, which is the breadbasket of the nation. If this drought continues, as it has for almost 3 years, it is very likely that food prices will increase substantially across North America.

Putting on my Engineering hat, it is very clear to me that the large temperature swings over short periods of time that occur as the jet stream troughs and ridges sweep past a fixed region such as a city are wreaking havoc on infrastructure. We have commonly been getting temperature swings of 40 degrees Celsius (72 degrees F) within a day or two. These swings usually cross zero, and result in torrential rain events followed by flash freezing and then large amounts of snow, or the inverse process occurs, often in a cycle over a week. Clearly buildings, roads, railroad tracks, and pipelines are under siege from these temperature swings, precipitation changes and repeated freeze/thaw cycles.

Consider a railroad track. The rails are basically two ribbons of steel of length L separated by width w that are held in place by spikes onto wooden railroad ties. Each section L is joined to adjacent sections with spacers. The tracks are designed for a nominal temperature range. At the high end temperature, the steel expands to its maximum length, and adjacent sections butt together at the join. At the low end temperature, the steel contracts and the gap between adjacent rails is at a maximum. As the daily temperature varies between the lows and highs, the rail expands and contracts. Similarly, for seasonal changes. All within design tolerances. What we are seeing now is a higher frequency of extreme temperature swings of 40 degrees C or larger (72 degrees F), which is greatly stressing the rail infrastructure. These large swings are stretching the limits of the design tolerances since they exceed the usual daily temperature ranges, and occur way faster than any seasonal change. In combination with the explosion of rail traffic from oil trains, the risk of derailment accidents has greatly increased, and we are seeing an enormous increase in derailments. We have also seen a large increase in the frequency, amplitude, duration, and spatial area of torrential rainfall events which have led to floods and extreme river flow rates which undercuts bridges and also leads to more rail derailments. Especially when the rail is submerged for extended periods of time, as occurred, for example in Colorado in late summer 2013.

Ditto with pipelines. Pipeline sections are attached to each other via welds or sleeves and during extreme temperature swings the expansion and contraction of concern is in the longitudinal direction of the pipe. The pipelines are usually buried a few meters under the ground, which can reduce the temperature variation during the atmospheric temperature swings, however where they cross rivers and streams they are exposed to the changing elements and river flows. They are also susceptible to flash freeze events in which large sections of the ground contract and lead to cracking and soil displacement. Water saturation levels in the soils has a large effect on pipeline stresses, and can undergo rapid changes from rapidly changing precipitation cycles.

We are all familiar with how roads fare under extensive freeze/thaw cycles. Even worse, the ice melting salt corrodes guardrails, signs, and posts and as cracks open up in the asphalt salty water percolates in and the freeze thaw cycles widen the cracks leading to potholes and road breakup. And that is in northern latitude regions that have a regular snow in winter climate. In more southern regions that are unaccustomed to snow, there is widespread use of concrete for road surfaces. When there are large temperature swings the concrete is more prone to cracking and it is more difficult to remove snow and ice from these roads, since there is a lack of snow removal equipment and salt in these regions, and the concrete is lighter in color and thus absorbs less solar energy than asphalt and thus stays colder.

The biggest problem that homeowners face in more southern latitudes from these deep freeze situations, apart from personal discomfort in poorly insulated homes, is water pipe freezing and rupturing. Leaving the water taps all partially open to ensure a trickle of water flow through the pipes alleviates a lot of this problem.

In summary, climate change caused extreme weather events are severely stressing infrastructure like roads, bridges, rail, pipelines, and buildings. Much of this infrastructure was built many years ago and upgrading and maintenance has been neglected due to postponed and reduced budgets; while traffic on rail, for example has exploded in volume and weight. We are now facing the consequences of accelerated climate change and the years of neglect of our aging infrastructure.

In the video below, Paul says more about the damage to railway tracks and pipelines.


Southern Hemisphere Climate Changes

In the video below, Paul Beckwith explains how declining Arctic sea ice is causing Australia to bake and Antarctic sea ice to grow.


to be continued

Sabtu, 18 Januari 2014

Our New Climate and Weather


by Paul Beckwith

The familiar global weather patterns that we, our parents, and our grandparents (and most of our distant ancestors, at least as far back as the last ice age remnants) have always experienced are no more. We have entered an abrupt climate change phase in which an energized water primed atmosphere and disrupted circulation patterns give rise to unfamiliar, massive and powerfully destructive storms, torrential rains, widespread heat waves and droughts, and less commonly but occasionally widespread cold spells.

Why is this happening now? Sophisticated Earth System computer Models (ESMs), summaries of state-of-the-art peer reviewed climate science (Intergovernmental Panel on Climate Change IPCC), and mainstream science have generally put the climate change threat out to the latter part of the century. Global data from all parts of the world, but most noticeably the Arctic shows that reality is quite different from these models and mainstream thinking.

Just by looking out the window much of humanity now senses that something is very different, and uncomfortably wrong in their particular region.

Depending on location, vegetation is drying out and burning, or being toppled by very high wind events, or oceans are invading upon coastlines, or rivers are overrunning banks or drying up or both, while rainfall deluges are inundating other regions. In fact some regions are vacillating between massive floods and massive droughts, or record high temperatures and record low temperatures, even on a weekly basis.

As crazy as things are now, clearly they are not bad enough to wake up the general population enough to vote down denier politicians and demand extensive governmental action on the problem. Not to worry, that action is a sure bet in the near future, the only question is will it happen next year, or in 3 years?

In the meantime, many of us are doing as much as we can to educate people on the dangers we face and speed up the understanding of climate reality process. As much as we do, ultimately it is the hammer of extreme weather, causing, for example global crop failures or taking out a few more cities in rich countries that will take the final credit for an abrupt tipping point in human behavior.

The key to the disruption in the climate system is the Arctic.

Human emissions have inexorably increased levels of carbon dioxide and methane (Greenhouse gases GHGs) in the atmosphere sufficiently to cause an incremental overall increase of global mean surface temperature by 0.8 degrees C over the last century. Over the last 3 decades, the GHGs have caused sufficient warming in the Arctic to melt enough land-covered snow and ocean covered ice such that the highly reflective surfaces have been replaced by dark underlying land and ocean greatly increasing sunlight absorption causing Arctic temperature amplification of 3x to 5x and higher.

This has melted permafrost on the land and on the shallow continental shelves and has increased Arctic methane emissions, which on a molecule-to-molecule basis cause warming >150x compared to carbon dioxide on a short timescale. Arctic temperature amplification has reduced the equator-to-Arctic temperature difference, which is responsible for setting up global circulation patterns on the rotating Earth. Thus, the high speed jet stream winds which circumvent the globe become slower, and wavier, and weather patterns change.

Extreme weather events become stronger, more frequent, of longer duration, and act on new regions. In effect, the climate background has changed, so the statistics of all weather events changes. When the ocean tide comes in all boats rise, when the climate system changes all weather events change.

So how does the North American freeze of early January, 2014 and the upcoming late January, 2014 freeze fit into this picture? In our familiar climate, the polar jet stream flowed mostly west to east (with small north-south deviations or waves, with typically 4 to 7 crests and troughs around the globe) separating cold dry Arctic air from lower latitude warmer moist air. The latitude of the jet moves southward in our winter and northward in our summer.

In our present climate the jet stream waviness has greatly increased and eastward average speed has decreased. Not only that, but in early January there were only two troughs (over North America and central Asia) and two crests (over Europe and the Pacific up through Alaska and the Bering Strait).

The troughs had temperatures 20 degrees C cooler than normal, while the crests had temperatures 20 degrees C warmer than normal. These large waves and slowing of the jet stream is directly responsible for the changes we have been experiencing in weather extremes. Cold or warm, depending on your location.

continued at part 2

Kamis, 16 Januari 2014

High methane levels over the Arctic Ocean on January 14, 2014

[ click on image to enlarge - note that 'level' is the peak reading for the respective altitude ]
Above image shows IASI methane levels on January 14, 2014, when levels as high as 2329 ppb were recorded. This raises a number of questions. Did these high methane levels originate from releases from the Arctic Ocean, and if so, how could such high methane releases occur from the seafloor of the Arctic Ocean at this time of year, when temperatures in the northern hemisphere are falling?

Location

Let's first establish where the methane releases occurred that caused these high levels. After all, high methane concentrations are visible at a number of areas, most prominently at three areas, i.e. at the center of the Arctic Ocean, in Baffin Bay and over an area in Asia stretching out from the Taklamakan Desert to the Gobi Desert.

Closer examination, illustrated by the inset, shows that the highest methane levels were recorded in the afternoon, and at altitudes where methane concentrations over these Asian deserts and over Baffin Bay were less prominent, leading to the conclusion that these high methane levels did indeed originate from the seafloor of the Arctic Ocean.

The image below, showing 1950+ ppb readings over the past few days, illustrates the magnitude of the methane concentrations over the Arctic Ocean.


High concentrations persist over the Arctic Ocean

High methane concentrations have persistently shown up over the Arctic Ocean from October 1, 2013, through to January 2014. On January 19, 2014, levels as high as 2363 ppb were recorded over the Arctic Ocean, as illustrated by the image below.

[ click on image to enlarge ]
Causes

What caused these high releases from the seafloor of the Arctic Ocean to persist for so long? At this time of year, one may have thought that the water in the Arctic Ocean would be much colder than it was, say, on October 1, 2013.

Actually, as the combination image below shows, sea surface temperatures have not decreased much at the center of the Arctic Ocean between early October, 2013 (left) and January 14, 2014 (right). In the area where these high methane concentrations occured, sea surface temperatures have remained the same, at about zero degrees Celsius.

[ click on image to enlarge ]
Furthermore, as the above image shows, surface temperatures in the Atlantic Ocean may have fallen dramatically with the change of season, but temperatures in the Arctic Ocean have changed only little.

In this case of course, what matters more than surface temperatures are water temperatures at greater depth. Yet, even here temperatures in the Arctic Ocean will have decreased only slightly since early October 2013, as the Gulf Stream has continued to push warmer water into the Arctic, i.e. water warmer than the water in the Arctic Ocean. In other words, the heating impact of the Gulf Stream has continued.

Furthermore, as the sea ice extent increased, there have been less opportunities for the heat to evaporate on the surface and for heat to be transferred from the Arctic Ocean to the air.

Finally, what matters a lot is salinity. The combination image below compares salinity levels between October 1, 2013 (left), and January 14, 2014 (right).

[ click on image to enlarge ]
Salinity levels were low on October 1, 2013, as a lot of ice and snow had melted in the northern summer and rivers had carried a lot of fresh water into the Arctic Ocean. After October 1, 2013, little or no melting took place, yet the Gulf Stream continued to carry waters with higher salt levels from the Atlantic Ocean into the Arctic Ocean.

Annual mean sea surface salinity
Seawater typically has a salinity level of over 3%; it freezes and melts at about −2°C (28°F). Where more saline water from the Atlantic Ocean flows into the Arctic Ocean, the water in the Arctic Ocean becomes more saline. The freezing and melting point of fresh water (i.e. zero salinity) is 0°C (or 32°F). More salinity makes frozen water more prone to melting, i.e. at temperatures lower than 0°C, or as low as −2°C.

As the salinity levels of the water on the seafloor of the Arctic Ocean increased, the ice that had until then held the methane captive in hydrates on the seafloor of the Arctic Ocean started to melt. Indeed, the areas in the Arctic Ocean where the high methane releases occurred on January 14, 2014 (top image) show several practical salinity units (psu) increase since October 1, 2013.

Higher salinity levels are now reaching the faultline that runs through the Arctic Ocean from the top of Greenland to the Laptev Sea, where major releases are taking place now, as illustrated by the image below, with faultlines added on the insets.

[ click on image to enlarge ]
Above image shows methane levels recorded on the evening of January 16, 2014 (main image). The top left inset shows all methane readings of 1950 ppb and higher on January 15 and 16, 2014, while the bottom left inset shows methane readings of 1950 ppb and higher on January 16, 2014, p.m. only and for seven layers only (from 469 to 586 mb), when levels as high as 2353 ppb were reached (at 469 mb).

Quantities

These high levels of methane showing up over the Arctic Ocean constitute only part of the methane that did escape from the seafloor of the Arctic Ocean. Where these high concentrations did show up, the ocean can be thousands of meters deep, giving microbes plenty of opportunity to decompose methane rising through the water first. Furthermore, the methane has to pass through sea ice that is now getting more than one meter thick in the area where these high levels of methane showed up on satellite records. In conclusion, the quantities of methane that were actually released from the seafloor must have been huge.

Importantly, these are not one-off releases, such as could be the case when hydrates get destabilized by an earthquake. As the Arctic-news blog has documented, high releases from the seafloor of the Arctic Ocean have been showing up persistently since early October 2013, i.e. three months ago. This blog has warned about the threat for years. This blog has also described in detail the mechanisms that are causing these releases and the unfolding climate catastrophe that looks set to become more devastating every year.

Given that a study submitted in April 2013 concluded that 17 Tg annually was escaping from the East Siberian Arctic Shelf alone, given the vast quantity of the releases from hydrates that show up on IASI readings and given the prolonged periods over which releases from hydrates can persist, I put the methane being released from hydrates under the seafloor of the Arctic Ocean in the highest category, rivaling global emissions from fossil fuel, from agriculture and from wetlands. As said, the amounts of methane being released from hydrates will be greater than the methane that actually reaches the atmosphere. To put a figure on the latter, my estimate is that emissions from hydrates and permafrost currently amount to 100 Tg annually, a figure that is growing rapidly. This 100 Tg includes 1 Tg for permafrost, similar to IPCC estimates.


This is vastly more than the IPCC's most recent estimates, which put emissions from hydrates and permafrost at 7 Tg annually, a mere 1% of the total annual methane emissions globally, as illustrated by the image below.


Impacts and Response

Huge releases from the seafloor of the Arctic Ocean have occurred persistently since early October 2013, even when releases like this may show up for one day in one area without showing up in that same area the next day on satellite images.

This apparent 'disappearance' can be due to the Coriolis effect that appears to move the methane, whereas it is in fact the Earth that is spinning underneath the methane. This doesn't mean that the methane had disappeared. Actually, much of this methane will persist over the Arctic for many years to come and will continue to exercize its very high initial warming potential over the Arctic for years.

Furthermore, even if less methane may show up on satellite images the next day, that doesn't necessarily mean that releases from the seafloor has stopped. Instead, it looks like methane is being released continuously from destabilizing hydrates. The methane may accumulate underneath the sea ice for some time, to burst through at a moment when fractures or ruptures occur in the sea ice, due to changes in wind and wave height.


The threat here is that methane will further warm up the air over the Arctic, causing further weakening of the Jet Stream and further extreme weather events, particularly extreme warming of water all the way along the path of the Gulf Stream from the Atlantic Ocean into the Arctic Ocean, in turn triggering further releases from hydrates at the seafloor of the Arctic Ocean and escalating into runaway global warming. This threat calls for comprehensive and effective action, such as described at the ClimatePlan blog.